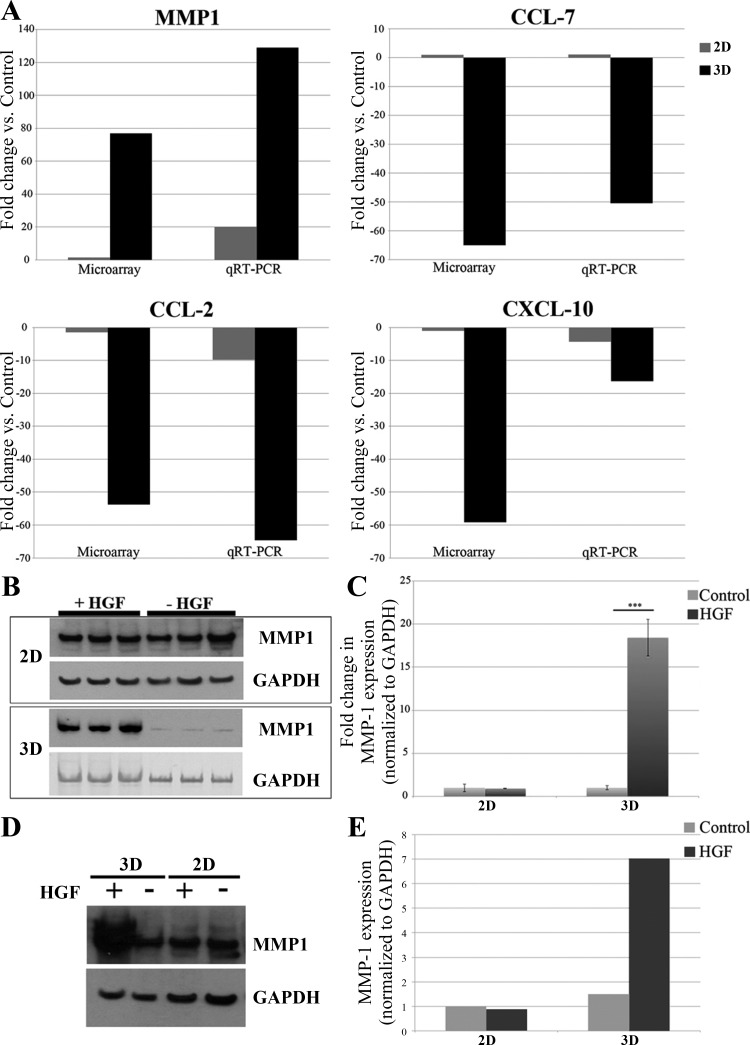
Fig. 2.
Matrix metalloproteinase 1 (MMP1) is upregulated in 3D but not in 2D cells. A: validation of microarray results by quantitative real-time PCR (qRT-PCR): MMP1 fold change in gene expression after HGF treatment in 2D vs. 3D. Both microarray analysis and qRT-PCR indicate that MMP1 gene expression after HGF treatment increases more in 3D (black) than in 2D (gray); C-C motif chemokine ligand (CCL)-7 fold change in gene expression after HGF treatment in 2D vs. 3D. Microarray analysis and qRT-PCR show that CCL-7 does not change in 2D (gray) but is downregulated in 3D (black); CCL-2 fold change in gene expression after HGF treatment in 2D vs. 3D. Both microarray analysis and qRT-PCR indicate that CCL-2 gene expression after HGF treatment is downregulated more in 3D (black) than in 2D (gray); C-X-C motif chemokine ligand (CXCL)-10 fold change in gene expression after HGF treatment in 2D vs. 3D. Both microarray analysis and qRT-PCR indicate that CXCL-10 gene expression after HGF treatment is downregulated more in 3D (black) than in 2D (gray). B: Western blot analysis of MMP1 expression in 2D and 3D MDCK cells ± HGF. MMP1 protein expression (top) significantly increases in 3D + HGF but not in 2D + HGF. GAPDH (bottom) is shown as a loading control. Please note that 2D and 3D Western blots were run on separate gels and should not be compared directly with each other. C: quantification of MMP1 protein expression in 2D and 3D MDCK cells ± HGF. All blots were normalized to GAPDH expression. ***P < 0.005 (Student's t-test). D: from the same Western blot. MDCK cells express MMP1 at slightly higher levels when cultured in 3D than when cultured in 2D, even before the addition of HGF. To detect MMP1 in lysates from 2D-cultured cells, protein loading was greater than that needed to detect MMP1 in lysates from 3D-cultured cells. E: Western blot quantification of MMP1 expression in 2D and 3D MDCK cells ± HGF. The degree of MMP1 expression in each condition was determined by calculating the area of the band, as the density of the bands was relatively similar in this exposure.

