Fig. 3.
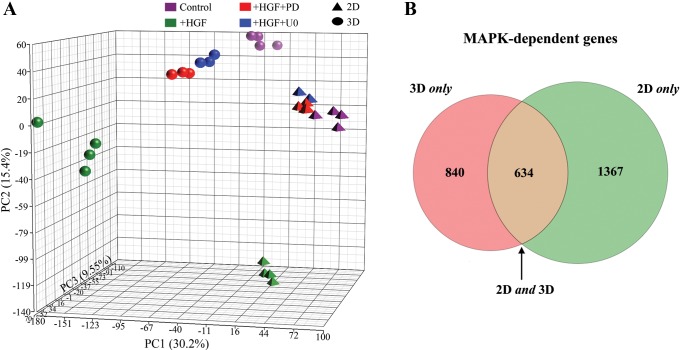
Subtraction pathway microarray analysis was used for identification of MAPK-dependent gene expression. A: Principal Components Analysis (PCA) was used to plot the treatment groups. Each axis is a linear combination of all 20,000 transcripts, each with its own coefficient chosen in such a way as to best show the sample variation. Each axis is assigned a percentage, indicating the fraction of total variation captured. The axes are built, such that this fraction is greatest in x > y > z. Note that HGF + inhibitor-treated groups [red, PD098059 (PD); blue, U0126 (U0)] are closer to the control cells (purple) in the PCA plot than the HGF-treated cells (green). B: Venn diagram of 2D and 3D MAPK-dependent gene expression. A total of 2,841 genes was identified as MAPK dependent in the subtraction microarray: 840 (30%) changed only in 3D (pink), 634 (22%) changed in 2D and 3D (brown), and 1,367 (48%) changed only in 2D (green).

