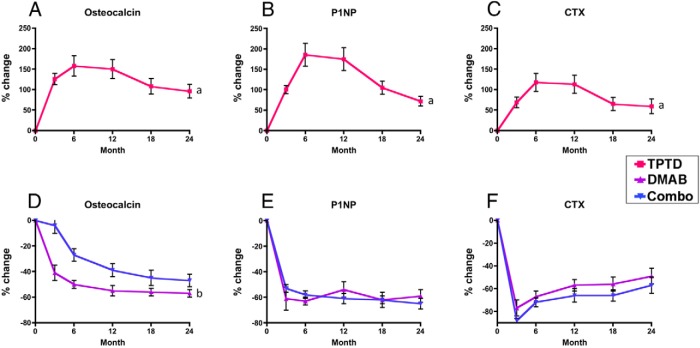
Figure 4.
Markers. Mean percent change (SEM) in bone turnover markers from baseline to 24 months in the teriparatide (TPTD, A–C) and denosumab (DMAB) and combination (Combo) groups (D–F). a, P < .0001 vs denosumab and combination at all time points. b, P < .005 vs denosumab at all time points. Data for the teriparatide group and other groups are graphed separately for figure clarity. Error bars that are not seen are contained within the symbols.

