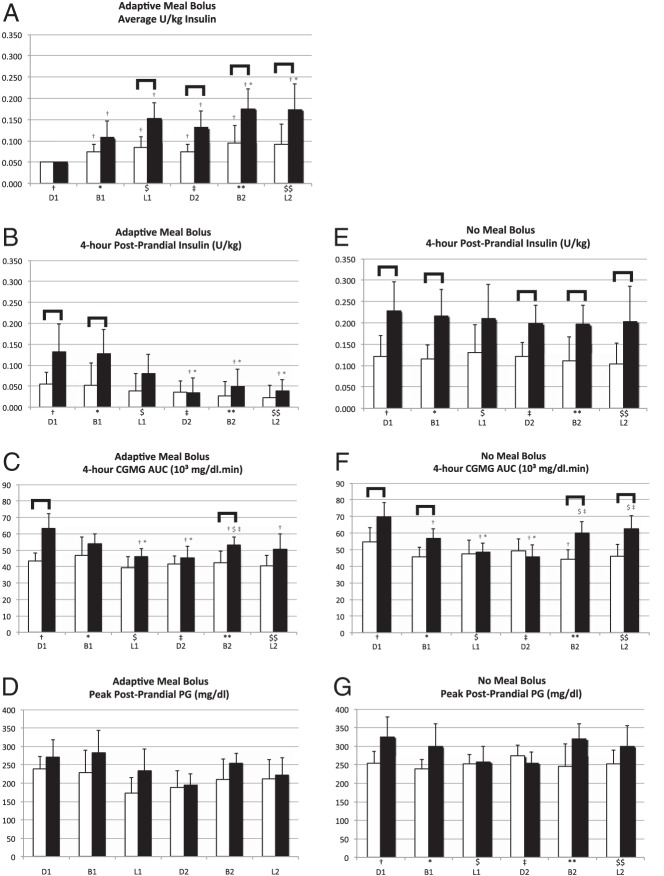
Figure 4.
Glycemic control quantities relating to the times around the six meals, ordered as first dinner (D1), first breakfast (B1), first lunch (L1), second dinner (D2), second breakfast (B2), and second lunch (L2). For each meal, the bar on the left relates to adults and the one on the right relates to adolescent subjects. Each of the six meals is assigned a reference symbol: †, D1; *, B1; $, L1; ‡, to D2; **, B2; and $$, L2. The appearance of any meal symbol above a bar pertaining to any of the other five meals for the same age group indicates a statistically significant difference (P < .5) in the values of the represented quantity for those two meals. The appearance of a square brace above any pair of bars indicates a statistically significant difference in the values of the represented quantities for that meal between the adult and adolescent cohorts. A, Average size of adaptive meal boluses. B and E, Four-hour postprandial insulin with AMB and NMB, respectively. C and F, Four-hour CGMG postprandial AUC with AMB and NMB, respectively. D and G, Peak postprandial PG with AMB and NMB, respectively.

