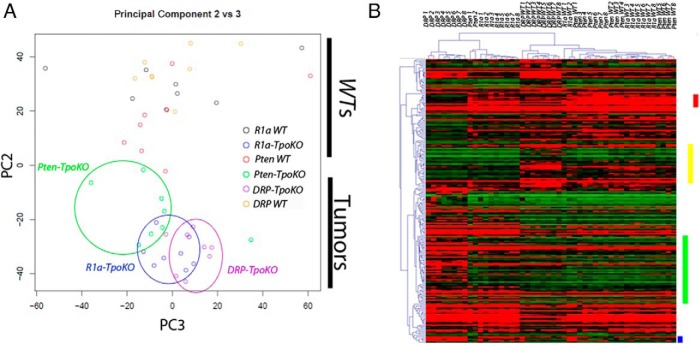
Figure 5.
Microarray data comparing Pten-, R1a-, and DRP-TpoKO tumors. Principal Component Analysis plot of all tumor microarray data (A) is shown. Circles group each of the tumor genotypes. Heat map of genes identified as having significant linear trend effect between the three data sets (B) is shown. Red bar denotes linear trend genes down-regulated in DRP-TpoKO tumors, yellow bar denotes those down-regulated in malignant tumors, green bar denotes those up-regulated in DRP-TpoKO tumors, and the blue bar denotes those up-regulated in malignant tumors. DRP WT, R1a WT, and Pten WT denote the WT littermates used for comparison for each model.

