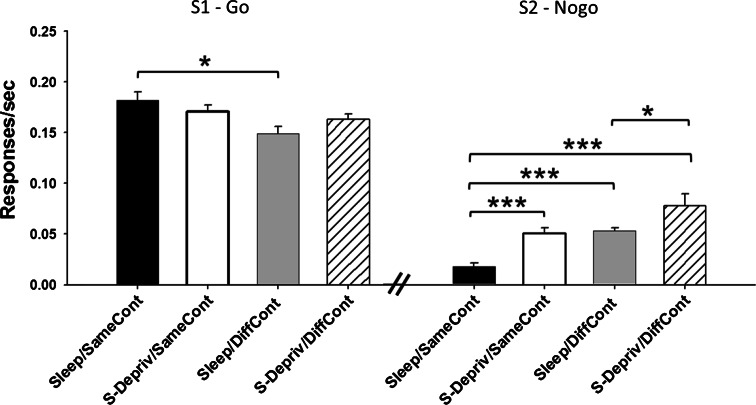
Fig. 2.
Mean (±SEM) responses (per second) during S1 (Go, left panel) and S2 (Nogo, right panel) of the conditional discrimination task at the test phase, separately for the Sleep/SameCont, the S-Depriv/SameCont, the Sleep/DiffCont, and the S-Depriv/DiffCont groups. An effect of sleep was revealed only for the response rate to S2 which improved (i.e., decreased) after sleep, with this effect being independent of the context in which the animal was tested. ***p < 0.001; **p < 0.01; *p < 0.05, for pairwise comparisons between groups

