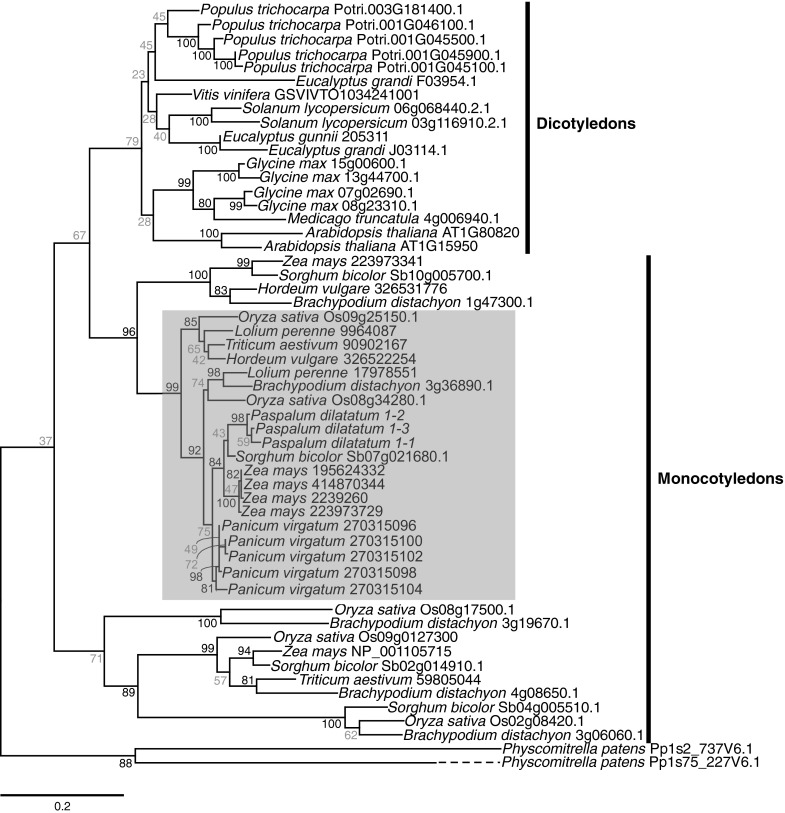
Fig. 2.

Maximum likelihood phylogeny of deduced CCR protein sequences from Viridaeplantae. Numbers at nodes correspond to ML bootstrap support. Moderate to strong support (>80) is shown in black, and weak support (>79) is shown in grey. The shaded box highlights CCR1 proteins from monocotyledons. The dashed line indicates a long branch
