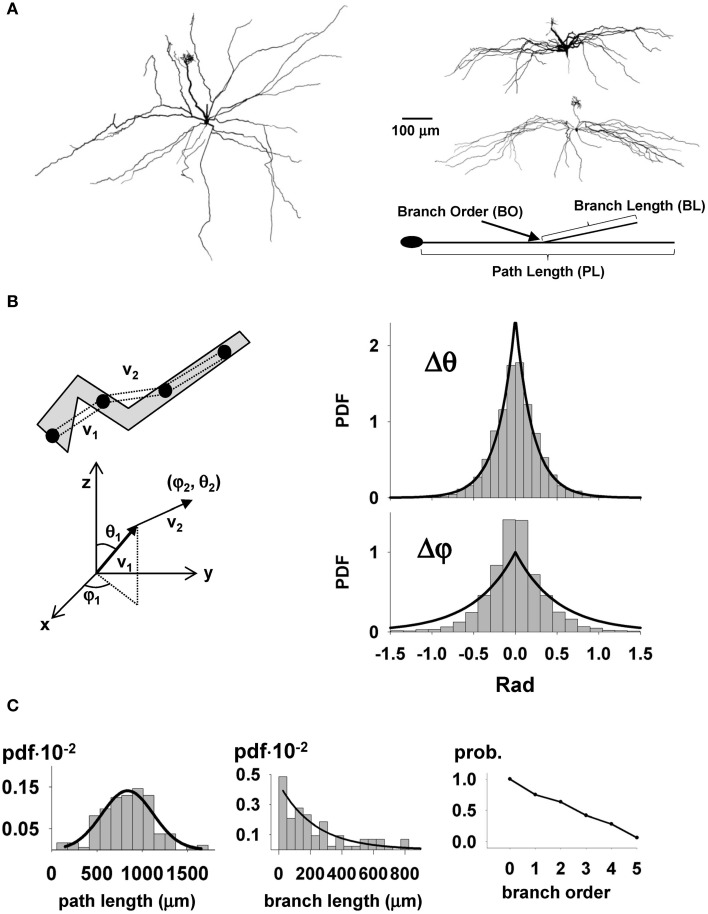
Figure 2.
Statistical parameters of full mitral cell 3D reconstructions. (A) Typical reconstructed mitral cells (courtesy of K. Mori and K. Igarashi): left, overhead view showing full branching pattern of lateral dendrites and primary dendrite with terminal tuft; right, lateral views of two cells showing restriction of lateral dendrites to the external plexiform layer. The parameters used for the synthetic reconstructions are schematically illustrated in the diagram at bottom; (B) To calculate the average growing direction of a dendritic section, the raw data points composing the dendrites were first resampled in 20 μm sections, as schematically illustrated in the top left, and then the spatial orientation of each section was calculated in spherical coordinates (below); (right) Probability distribution function for the relative displacement in the spatial orientation of two consecutive membrane sections in spherical coordinates; The observed values for Δθ and Δφ were reproduced by the Laplace distributions PDF(Δθ) = 3.125 · exp(−|Δθ|/0.16) and PDF(Δφ) = 3.57 · exp(−|Δφ|/0.14), respectively; (C) Probability distribution function for dendritic path length (left), branch length (middle), and branch order (right); lines on each graph represent the functions used to reproduce the experimental distributions; for path length: PDFPL(x) = 0.0014 · exp(−1/2 · ((x − 838)/283)2), for branch length: PDFBL(l) = 0.0044 · exp(−l/0.0044).

