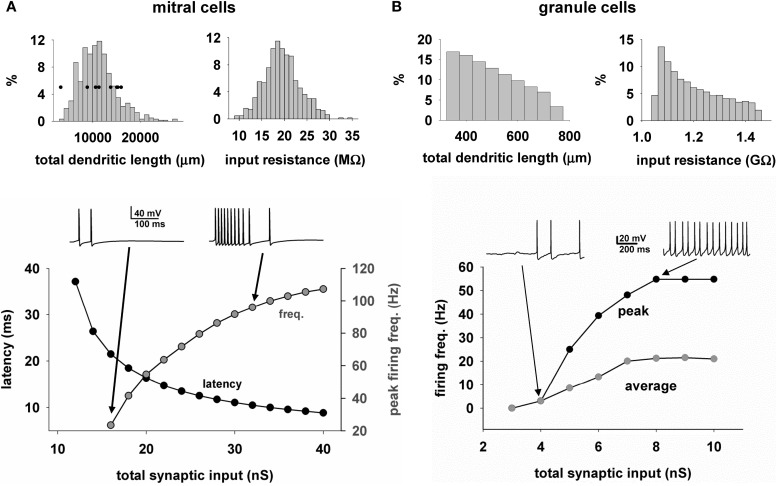
Figure 5.
Heterogeneity of mitral and granule cell properties. (A) The distribution of the total dendritic length (top left) and input resistance (top right) for the mitral cells (n = 635); (bottom) First action potential latency (black symbols) and peak firing rate (gray symbols) of a typical mitral cell, as a function of odor input strength; traces above the plot illustrate the somatic activity during activation of the synaptic inputs modeling an odor input (single sniff); Black symbols in top left graph are the values obtained from the experimental reconstructions; (B) Distribution of the total dendritic length (top left) and input resistance (top right) for the granule cells (n = 69013); (bottom) Peak (black symbols) and average (gray symbols) firing rate of a typical granule cell, as a function of the input strength; traces above the plot illustrate the somatic activity during activation of 50 excitatory synapses randomly placed over the radial dendrite.

