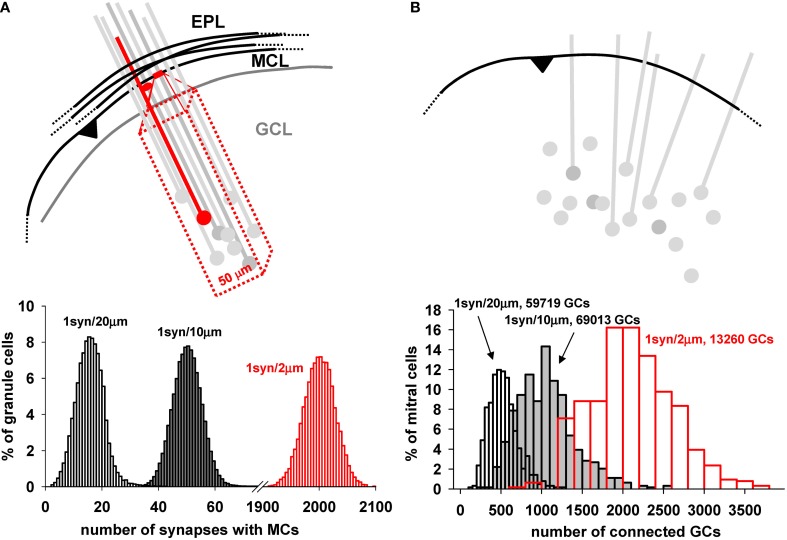
Figure 6.
Mitral cell—granule cell connectivity. (A) Each dendrodendritic synapse was formed by selecting a dendritic mitral cell segment every 10 μm (on average) and randomly selecting a granule cell within a 50 μm rectangular volume deep to that site in the GCL, as shown in the diagram. (B) (top) Schematic representation of the connectivity from a mitral cell point of view; a given dendrite along its entire length connects to many more granule cells; Below each panel is reported the proportion of granule cells with a given number of synapses with mitral cells (left), and the proportion of mitral cells connected to a given number of granule cells (right) using 1 synapse per 2, 10, and 20 μm; Both plots were generated with a model including a total number of 122,166 (gray and white bars) or 16,013 (red bars) granule cells. Close to each graph is indicated the number of granule cells effectively connected for each case.

