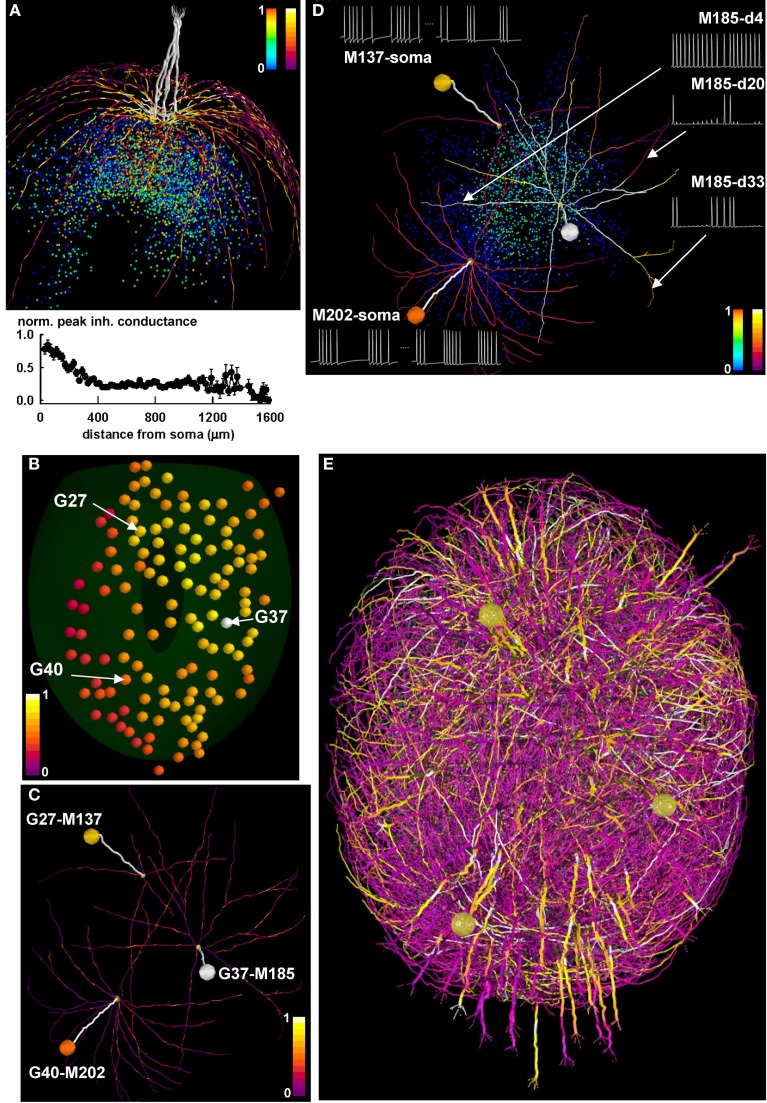
Figure 7.
Differential activity in mitral cell soma and dendrites depends on the spatial distribution of active granule cells. (A) (top) the final configuration of the inhibitory peak conductance on mitral cell dendrites after a 40 s simulation of a network composed of only 1 glomerulus; dendritic segments are color-coded for the peak (normalized) inhibitory inputs they receive from granule cells, and colored points represent granule cell somas color-coded according to the peak inhibitory conductance of their synapses on the mitral cells; color scales on the top right of the panel represent normalized peak inhibitory conductance for granule cells (left scale) and for dendritic segments (right scale); note the formation of potentiated synaptic clusters, highlighted by bright colored dendritic segments and red granule cell soma; (bottom) normalized average peak inhibitory conductance on the lateral dendrites, as a function of the distance from soma; (B) Glomerular activation patterns for odor mint, color-coded for normalized intensity; the spatial locations of three specific glomeruli (G27, G37, and G40) are indicated by the arrows; (C) Three of the mitral cells (M137, M185, and M202) connected to the three glomeruli, with dendritic segments color-coded for the peak (normalized) inhibitory inputs they receive from granule cells, after learning mint odor; (D) The three mitral cells, with dendritic segments color-coded according to their average instantaneous firing activity at the end of the learning phase for mint odor. Colored points represent granule cell somas, and are color-coded according to the peak inhibitory conductance of their synapses on the mitral cells; traces on the right show typical 350 ms of membrane potential at different dendritic locations for M185; traces on the left show somatic potential of M137 and M202 during a 500 ms time window at the beginning and at the end of the learning phase for odor mint; the two time windows are separated by a dotted line; color scales on the bottom right of the panel represent normalized peak inhibitory conductance for granule cells (left scale) and for average instantaneous firing rate at dendritic segments (right scale); (E). Snapshot of the response of the olfactory bulb system from a movie during presentation of the mint odor. A subset of the mitral cell dendritic network in the dorsal olfactory bulb is shown color-coded for membrane potential; inactive dendritic segments are shown in purple, action potentials in yellow. For the sake of clarity only one mitral cell per glomerulus is represented, except for glomeruli G27, G37, and G40, which are represented with all of their mitral cells. In all panels, color scales indicate normalized values. Glomeruli are colored according to the instantaneous spiking activity in the mitral cell tufts; red indicates no activity, yellow indicates spiking activity in any of the tuft dendrites.

