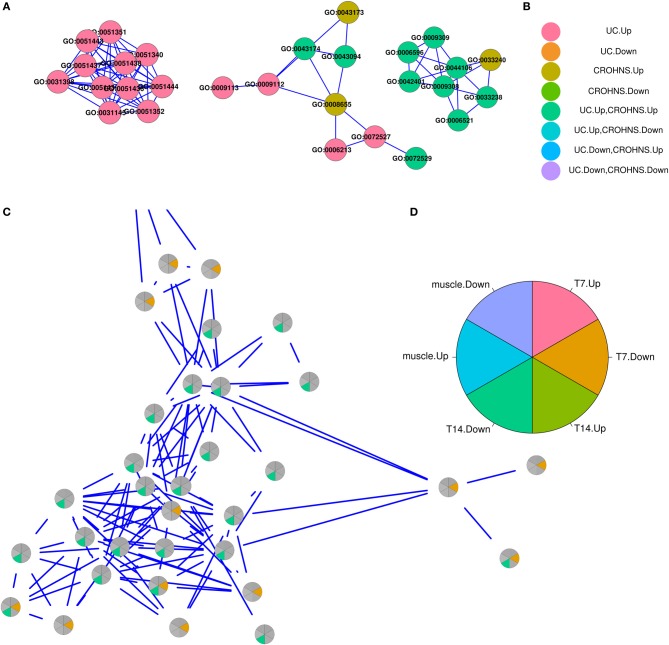
Figure 4.
Examples of annotations groups and associated legends. (A) From left to right, visualization of annotation groups “regulation of ubiquitination and ligase activity,” “nucleoside and nucleotide metabolism,” and “amine metabolism,” with associated legend in (B). (C) Pie chart visualization of annotation group “muscle fiber development,” with legend in (D).

