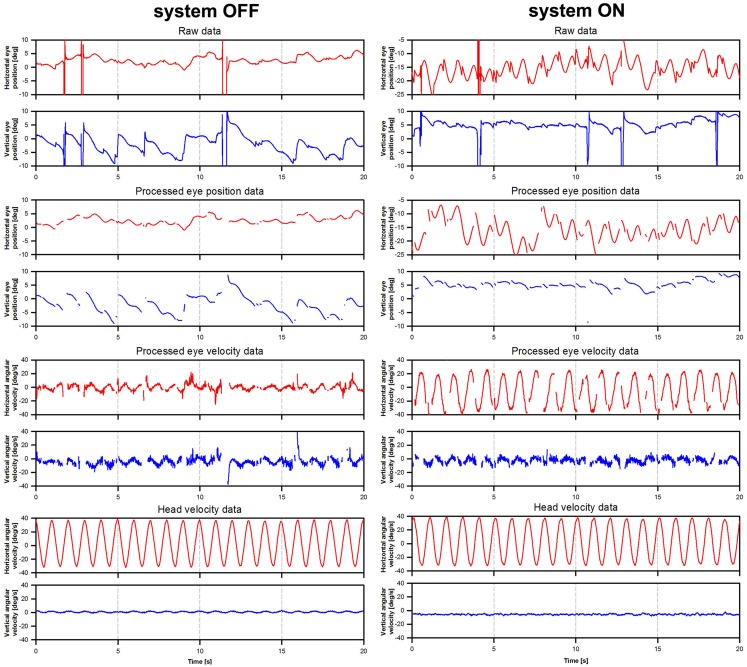
Figure 2.
Illustration of eye movement data processing. The figure presents eye movement data tracings for patient BVL1, gathered during the rotation experiments at a frequency of 1 Hz (modulation strength corresponding to 50% of the patient’s dynamic range). The panels on the left show data acquired during the system OFF experiments. The panels on the right show data gathered during the system ON experiments. Three steps are illustrated: raw eye position (e.g., before any processing was performed), processed eye position data (e.g., eye position data after blinks and quick eye movements >1000°/s2 were removed), and processed eye velocity data (e.g., obtained from the differentiation of the processed eye position data).

