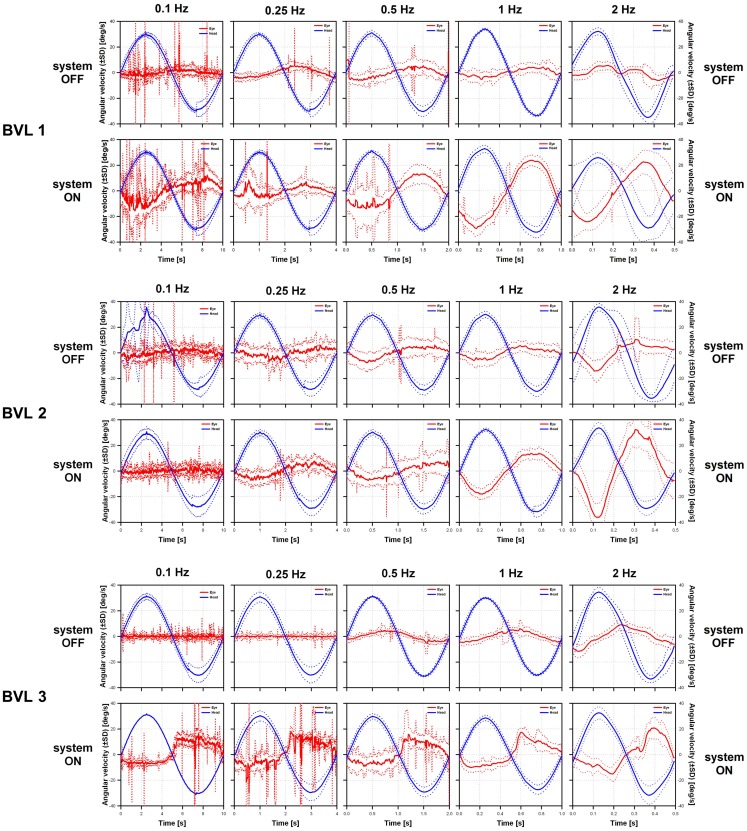
Figure 3.
Vestibulo-ocular reflex responses of the three implanted patients to 30°/s peak-velocity sinusoidal rotations around the vertical axis in complete darkness at frequencies of 0.1, 0.25, 0.5, 1, and 2 Hz (columns). For each patient, the panels on the upper row show data gathered in the system OFF condition. The panels on the lower row show data gathered in the system ON condition. Solid lines represent the average cycle plots (±standard deviation, SD shown in dotted lines) of the horizontal angular velocity of the eye (red lines) and the head (blue lines). Note that at the lower frequencies eye movement recordings were polluted by random artifacts mainly due to the long duration of cycles at these frequencies (e.g., 10 s for 0.1 Hz rotations).

