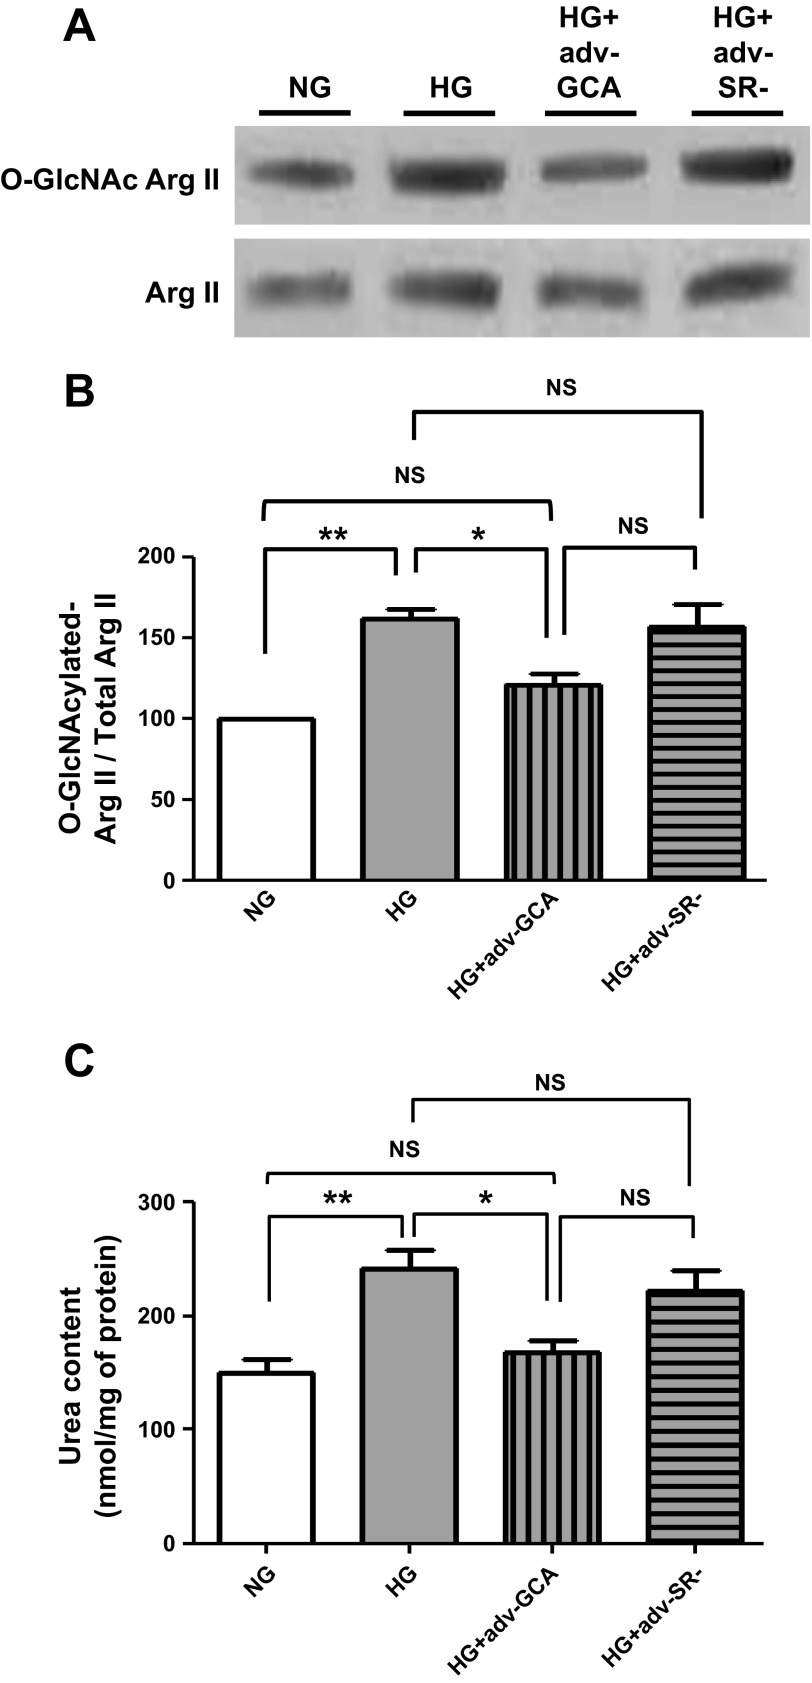
Fig. 10.
O-GlcNAcase effects on cardiac fibroblast arginase O-GlcNAcylation levels and activity. A: Western blots of arginase II O-GlcNAcylation levels. B: graphical representation of arginase II protein O-GlcNAcylation normalized to total arginase II in CF cultured in NG (5.5 mM dextrose), HG (25 mM dextrose), HG + GCA (Adv-GCA), or HG + SR- (Adv-SR-). C: graphical representation for changes in arginase activity levels (n = 3; *P < 0.05; **P < 0.01).

