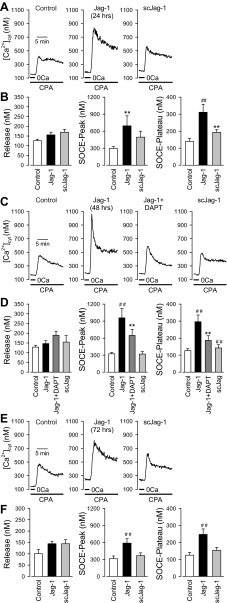
Fig. 4.
Prolonged treatment with Jag-1 enhances SOCE in human PASMC. SOCE was induced by passive depletion of Ca2+ from the SR with 10 μM CPA in human PASMC. The active fragment (aa 188–204) of human Jag-1 protein was used for stimulation of Notch receptors. A: representative records showing the increase in [Ca2+]cyt due to SOCE in control PASMC and PASMC treated with Jag-1 (50 μM for 24 h) and scrambled Jag-1 (scJag-1, 50 μM for 24 h). B: summarized data (means ± SE, n = 17–30 cells) showing the amplitude of the increase in [Ca2+]cyt due to Ca2+ release or leakage (left) and the amplitude of the peak (middle) and plateau (right) increases in [Ca2+]cyt in control PASMC and PASMC treated with Jag-1 or scJag-1 (for 24 h). C: representative records showing the increase in [Ca2+]cyt due to SOCE in control PASMC and PASMC treated with Jag-1 (50 μM for 48 h), Jag-1 + DAPT (50 μM and 10 μM, respectively, for 48 h), and scrambled Jag-1 (scJag-1, 50 μM for 48 h). D: summarized data (means ± SE, n = 17–30 cells) showing the amplitude of the increase in [Ca2+]cyt due to Ca2+ release or leakage (left) and the amplitude of the peak (middle) and plateau (right) increases in [Ca2+]cyt in control PASMC and PASMC with Jag-1, Jag-1 + DAPT, and scJag-1 (for 48 h). E: representative records showing the increase in [Ca2+]cyt due to SOCE in control PASMC and PASMC treated with Jag-1 (50 μM for 72 h) and scrambled Jag-1 (scJag-1, 50 μM for 72 h). F: summarized data (means ± SE, n = 17–30 cells) showing the amplitude of the increase in [Ca2+]cyt due to Ca2+ release or leakage (left) and the amplitude of the peak (middle) and plateau (right) increases in [Ca2+]cyt in control PASMC and PASMC treated with Jag-1 or scJag-1 (for 72 h). **P < 0.01 vs. vehicle control (Control, PASMC treated with 1% distilled water); ##P < 0.01 vs. Jag-1.

