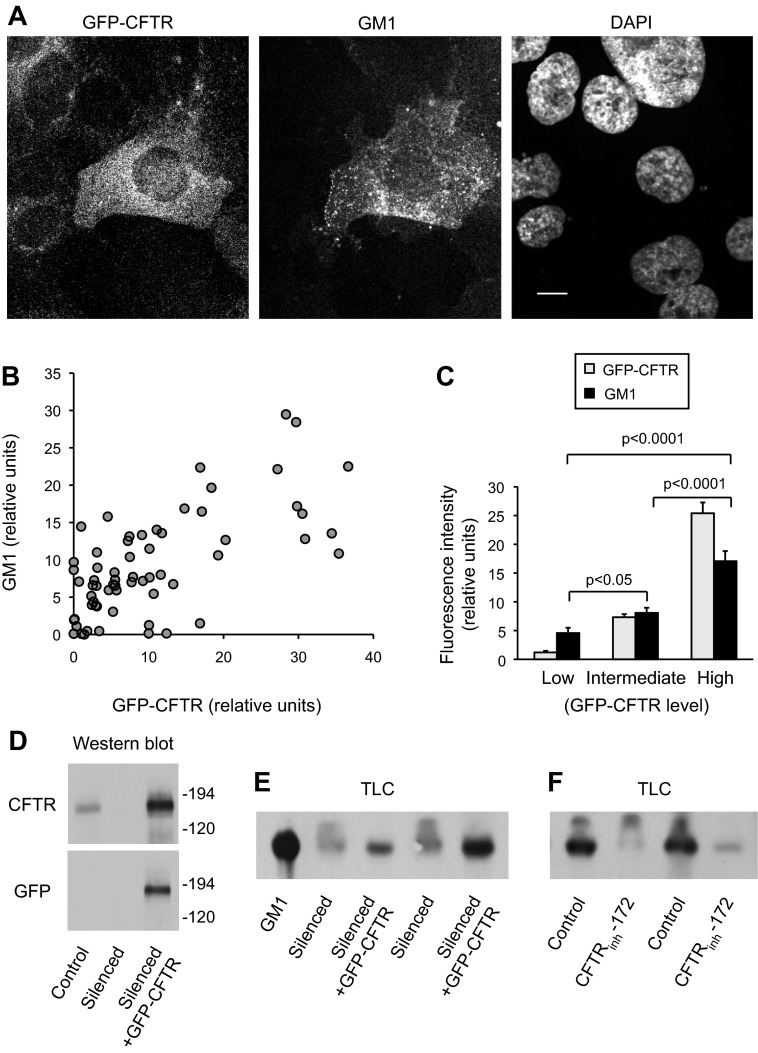
Fig. 3.
Regulation of GM1 levels by CFTR. CFTR-silenced cells were infected with green fluorescent protein (GFP)-CFTR adenovirus for 3 days. A–C: cells cultured on coverslips were fixed, stained with fluorescent CtxB to determine GM1 distribution, and observed by confocal microscopy. A: micrographs show the distribution of GFP-CFTR and GM1 and DAPI (to identify nuclei) in a field of cells. Bar, 10 μm. Note that the cell with highest GFP-CFTR level also has the strongest signal for GM1. B: fluorescence intensities for GFP-CFTR and CtxB (GM1) of individual cells from several micrographs were measured by image analysis and plotted. n = 64 cells. GM1 and GFP-CFTR levels were significantly correlated (Pearson product-moment R = 0.6942, P < 0.0001). C: using data in B, cells were categorized on the basis of GFP-CFTR intensity into low (lowest 25% of cells), intermediate (middle 50% of cells), and high (25% of cells with the highest GFP-CFTR intensity). Levels of GFP-CFTR and CtxB (GM1) in these 3 groups are compared in the bar graph. GM1 levels were significantly different between each group in two-tailed t-tests, as indicated by P values. D: lysates of control, CFTR-silenced cells, and CFTR-silenced cells infected with GFP-CFTR adenovirus were immunoblotted with antibodies against CFTR and GFP to show the expression of GFP-CFTR in adenovirus-infected CFTR-silenced cells. Equal protein quantities (40 μg) were loaded per lane. E: CFTR-silenced cells and CFTR-silenced cells infected with GFP-CFTR were extracted and analyzed for GM1 by TLC and CtxB staining as in Fig. 2D. Cell lysates equivalent to 1 mg protein were extracted for each lane. Two replicates for each condition are shown. A GM1 standard is also shown. F: control cells were treated with vehicle or with 30 μM CFTRinh-172 for 2 days and analyzed for GM1 levels as in E. Two replicates for each condition are shown.

