Fig. 5.
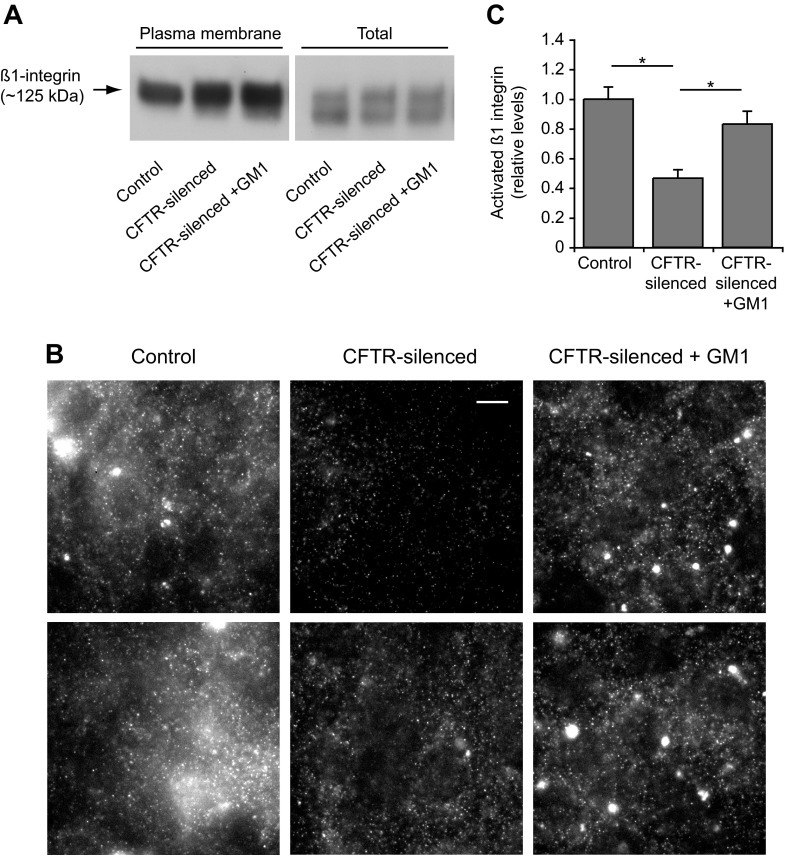
CFTR silencing reduces β1-integrin activation. Control and CFTR-silenced cells were cultured for 2 days in serum-free media. CFTR-silenced cells were also cultured in the presence of 5 μM GM1 as indicated. A: plasma membrane and total levels of β1-integrin as assessed by immunoblotting. Live control and CFTR-silenced cells were incubated with activated biotin reagent for 30 min at 4°C to label plasma membrane proteins. Cell lysates were prepared, and biotinylated proteins were captured using streptavidin-coated beads. Samples of biotinylated proteins recovered from beads and total lysates were then analyzed for β1-integrin by immunoblotting. B: β1-Integrin activation in control and CFTR-silenced cells was assessed by immunofluorescence using the HUTS-4 antibody, which only recognizes activated β1-integrin. Two examples are shown of control, CFTR-silenced, and CFTR-silenced + GM1 cells. Within each horizontal set, each image was processed identically so that intensities can be compared. Note that HUTS-4 stained diffuse membrane as well as punctate structures. Bar, 10 μm. C: quantitation of activated β1-integrin levels by image analysis of HUTS-4 staining as shown in B. Values were normalized to control levels and are means ± SE of 10–15 micrographs containing ≥20 cells per micrograph for each condition. *P < 0.01, significant differences between indicated groups as calculated using one-way ANOVA with a Bonferroni post test.

