
Figure 2.
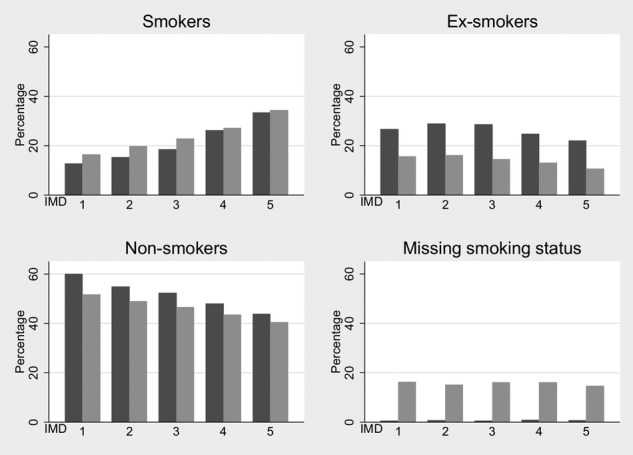
Smoking status percentages in The Health Improvement Network (THIN) and the Health Survey for England (HSE) 2008 by deprivation quintile. Index of Multiple Deprivation (IMD) 1 is the least deprived and IMD 5 is the most deprived. Darker bars represent the HSE 2008 and lighter bars represent THIN.