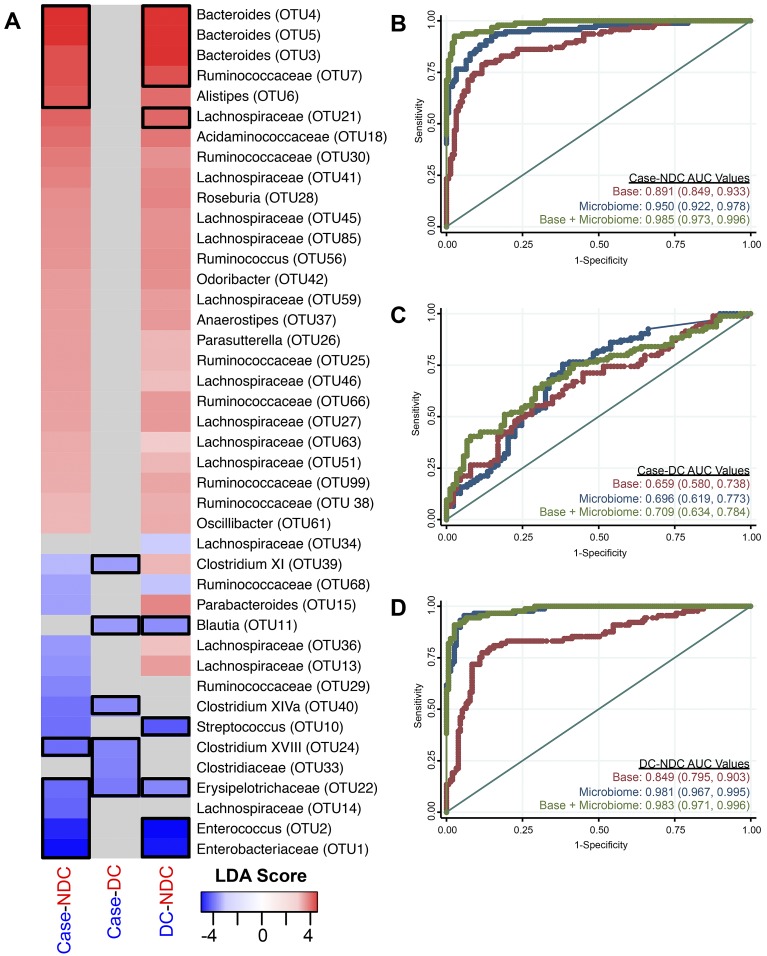
FIG 3 .
Specific bacterial populations clearly differentiate non-diarrheal controls from subjects with CDI and non-CDI-associated diarrhea. (A) LEfSe was used to compare cases and nondiarrheal controls, cases and diarrheal controls, and diarrheal controls and nondiarrheal controls. Only the LDA scores of significant OTUs are shown. Gray boxes indicate that values were not significant for the given comparison. The number following the bacterial name indicates the OTU number. Black boxes show the OTUs at the 0.25-percentile cutoff for each group that were chosen for inclusion in the microbiome models. DC, diarrheal control; NDC, nondiarrheal control. (B to D) ROC curves and AUC values with 95% confidence intervals in parentheses for each model comparing cases and nondiarrheal controls (B), cases and diarrheal controls (C), and diarrheal controls and nondiarrheal controls (D). Red represents the base model, blue represents the specific OTUs model, and green represents the base plus specific-OTU model. The straight line represents the null model.

