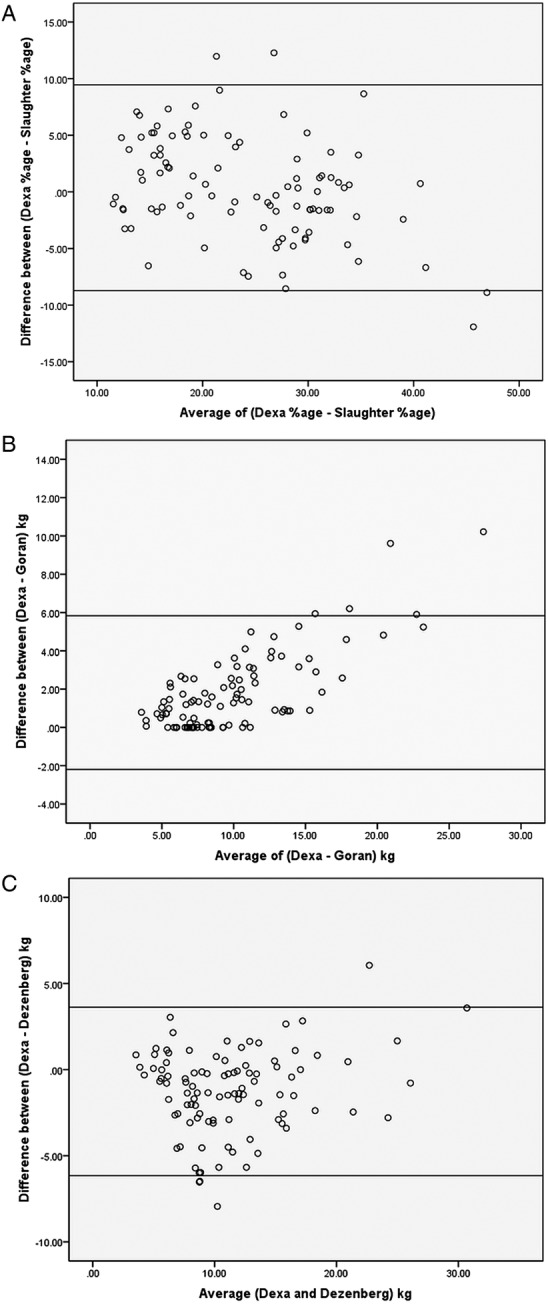
Figure 1.

(A) Bland Altman plot showing uniform distribution between percentage body fat calculated by dual energy X-ray absorptiometry (DEXA) and Slaughter equation. Although limits of agreement wide more than 75% of sample is between 5% variation; (B) significant overestimation of fat mass between DEXA and Goran equation with almost the entire sample above the 0 levels; (C) significant underestimation of fat mass with more than 60% of the sample lying below the 0 level in the Dezenberg equation.
