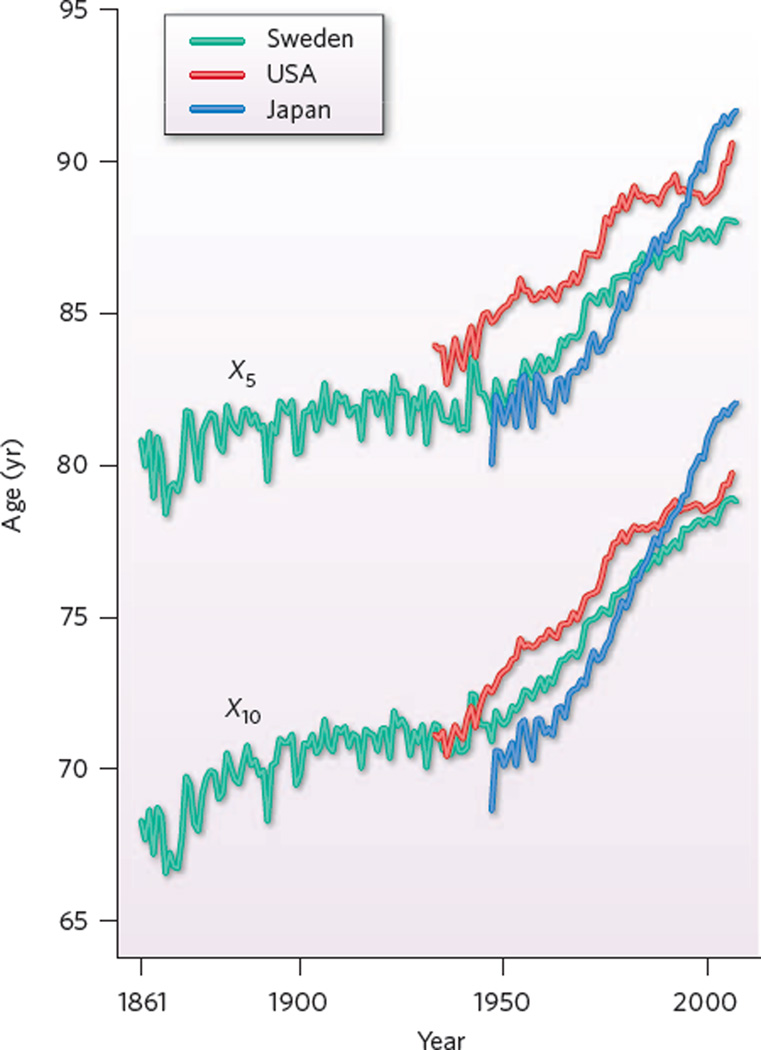
Figure 1. The postponement of mortality.
Historical trends in X5 and X10, the ages at which remaining life expectancies are, respectively, five and ten years, for females in Sweden (1861–2008), the USA (1933–2006) and Japan (1947–2008). For Swedish women, since 1950 senescence as measured by X10 has been postponed by about eight years. For Japanese women, since 1950 X10 has risen by about 12 years. Note that for all three countries, the curve for X5 follows the same general trajectory as the curve for X10 but at a roughly constant gap of about a decade of age. This indicates that senescence, as captured by these two measures, is being postponed rather than lengthened. Both indicators show that progress in postponing senescence was slow for women in the USA between 1980 and 2000. The prospects are that more rapid progress can be expected in the future77,83: the rapid rise in X5 and X10 in recent years for US women may be a harbinger of this. (Data extended and updated from a graph in ref. 14 using information from the Human Mortality Database (http://www.mortality.org), from Statistics Sweden for Sweden 2008 and from the Japanese Ministry of Health for Japan 2008.)

