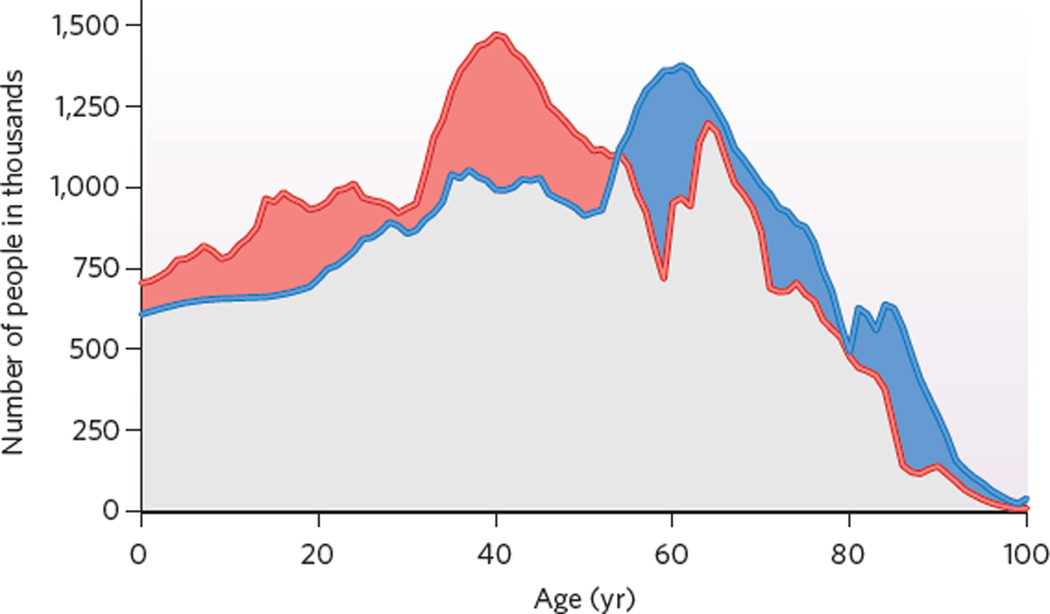
Figure 3. The population of Germany by age.
The number of people in 2005 (red line) and 2025 (projected, blue line) by single year of age in Germany. Note that the projected population distribution in 2025 is similar to the distribution in 2005 but shifted 20 years to the right. The differences between the two distributions are mainly due to mortality; international immigration and emigration are relatively unimportant in Germany. The area coloured in red represents the loss of people younger than age 54 from 2005 to 2025; the area coloured in blue represents the gain of people older than 54. (Data from the Human Mortality Database (http://www.mortality.org) and the Coordinated Population Projection for Germany, German Statistical Office.)

