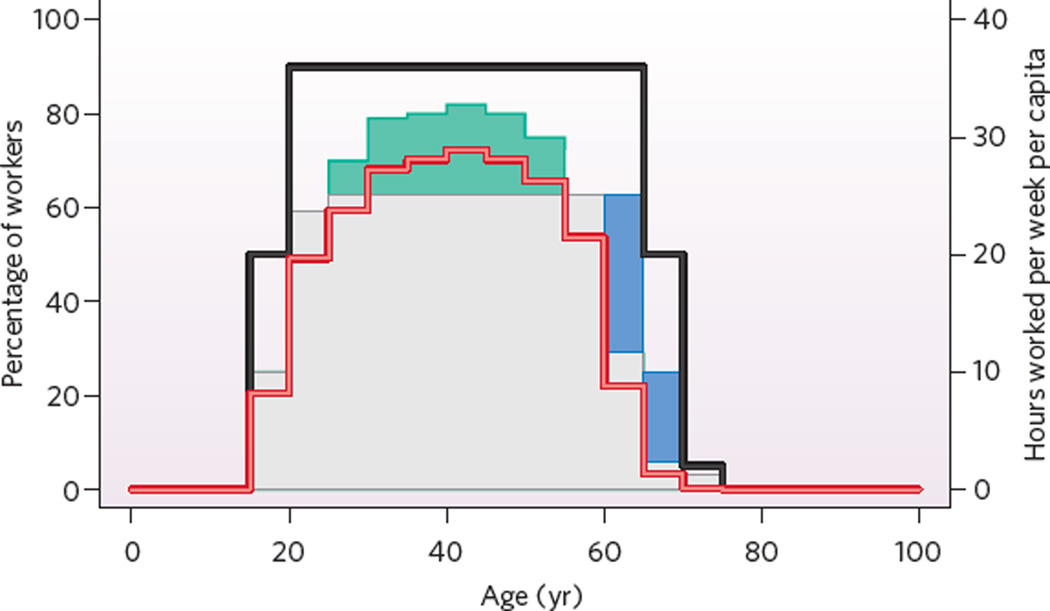
Figure 4. Employment in Germany by age.
Proportion of people by age working in Germany in 2005 (red line) and hypothetically in 2025 (black line), and hours worked per week per worker in 2005 (grey–green area) and hypothetically in 2025 (grey–blue area). Under the hypothetical scenario, at most ages a greater proportion of people would work, as shown by the difference between the black and red lines. At ages under 55, the employed in 2025 would work fewer hours per week on average than those in 2005: they would not contribute the work denoted by the green area. At ages between 60 and 70, the employed in 2025 would work more hours per week on average than those in 2005: they would contribute the additional work effort denoted by the blue area. In the hypothetical scenario, people aged from 20 to 65 work an average of about 25 hours per week: the 90% who work contribute about 28 hours of effort on average. If one-tenth of the population between ages 20 and 65 does not work at all, then another one-tenth could work 40 hours per week, four-tenths could work 30 hours per week and the remaining four-tenths could work 20 hours per week to maintain the work output at 2005 levels. (Calculations based on data from the EU Labour Force Survey.)

