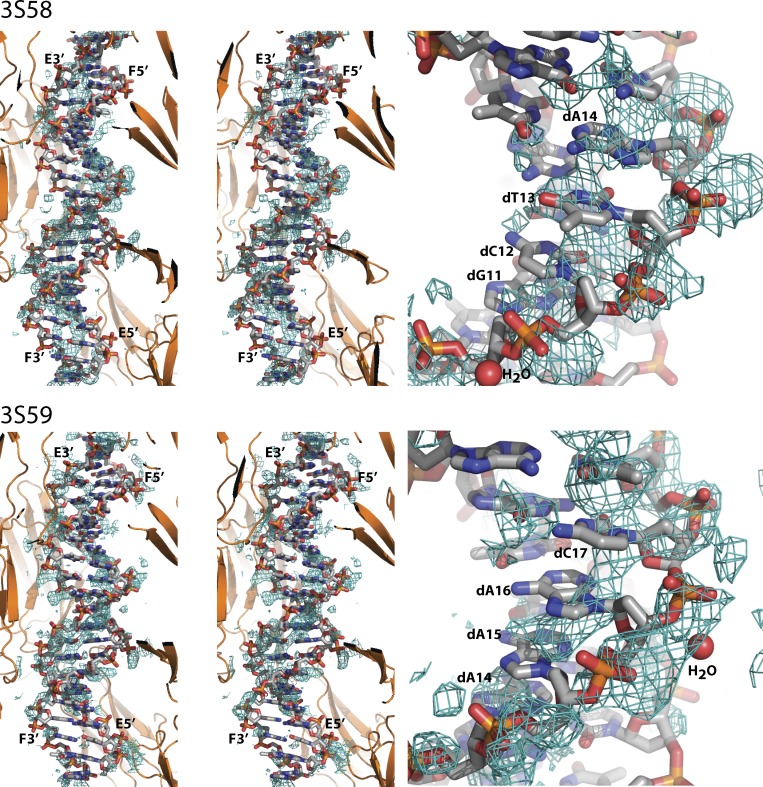
Figure 1.
Omit 2mFo-DFc electron density maps, contoured at 0.8σ, calculated after refinement of models devoid of DNA, water, and ligands against the deposited diffraction data. To the left, a stereo view for both structures showing the entire DNA double helix. The surrounding RAGE molecules are shown in cartoon representation. Only density within 4 Å of the shown DNA is displayed. The 5′- and 3′-ends of the two DNA chains E and F are labeled. To the right, a close-up of a selected region from each structure in which some density is observed that might represent backbone phosphates, but the density for the bases (labeled by nucleotide) does not allow sequence assignment. In both panels, DNA and water molecules (labeled H2O) were taken from the two coordinate entries, whereas the RAGE molecules result from our rerefinement against the deposited diffraction data.

