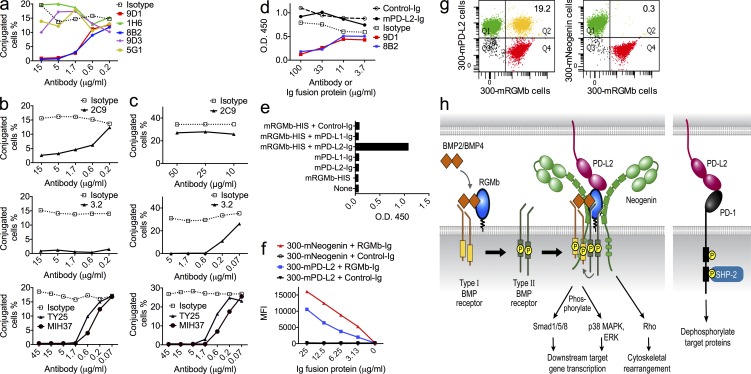
Figure 2.
Blocking capacities of RGMb and PD-L2 mAbs and a model for RGMb and PD-L2 interactions. (a–c) The blocking capacity of RGMb mAbs and PD-L2 mAbs was determined by cell conjugation assay. After cells were stained with dyes, (a) 300-mRGMb cells were incubated with the indicated concentrations of RGMb mAbs before incubation with 300-mPD-L2 cells; (b) 300-mPD-L2 cells were incubated with the indicated concentrations of PD-L2 mAbs before incubation with 300-mRGMb cells; or (c) before incubation with 300-mPD-1 cells. (d) mRGMb-HIS was preincubated with mAbs or Ig fusion proteins and then added to BMP-4–coated plates. Binding of mRGMb-HIS was detected by anti–penta-HIS-HRP in an ELISA. Similar results were seen with BMP-2 (not depicted). (e) mPD-L2-hIgG or control-hIgG were preincubated alone or with monomeric mRGMb-HIS, and then added to BMP-4–coated plates. Binding of Ig fusion proteins was detected with anti–hIgG-HRP in an ELISA. Similar results were also seen for BMP-2 (not depicted). (f) mNeogenin- or mPD-L2–transfected 300 cells were stained with indicated Ig fusion proteins or control-Ig and analyzed by flow cytometry. (g) Binding of 300-mRGMb cells to 300-mPD-L2 or 300-mNeogenin cells was analyzed by cell conjugation assay. Cells stained with a red dye were incubated with cells stained with a green dye and binding was measured by flow cytometry. (h) Molecular model depicting PDL2–BMP–BMPR–RGMb–neogenin and PD-L2–PD-1 pathways. All data are representative of two or more independent experiments.

