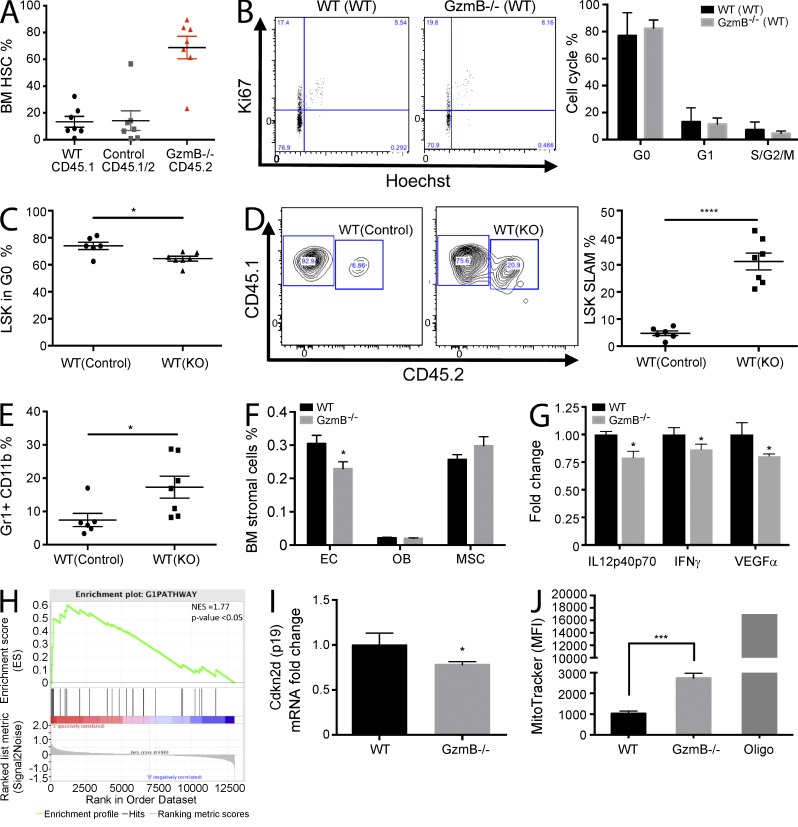
Figure 2.
GzmB-deficient BM microenvironment promotes stem and progenitor cell proliferation and improves HSC function. (A and B) CD45.2 GzmB−/− and WT CD45.1/2 (control) BM was transplanted into WT CD45.1 recipient mice. (A) Engraftment of HSCs was assessed by flow cytometry (black; n = 7). (B) The cell cycle status of transplanted WT CD45.1/2 and GzmB−/− CD45.2 HSCs was assessed by Ki67/Hoechst staining. The left panel shows representative flow cytometry plots, and the right panel shows quantification from n = 7 mice. (C) Reverse chimeras were generated by transplanting 106 CD45.1/2 WT BM cells into WT (WT(control)) or GzmB-deficient mice WT(KO) (n = 7). Percentage of LSK cells in G0 phase of the cell cycle was assessed by Ki67/Hoechst staining 16 wk after transplantation (n = 7). (D) Total BM was harvested from the primary recipients described in C, mixed at a 1:1 ratio with fresh CD45.1 WT total BM, and injected into lethally irradiated secondary CD45.1 WT recipients. LSK SLAM cells (CD45.1/2) were quantified in secondary recipients (CD45.1) by flow cytometry 16 wk after transplantation (n = 7). Representative flow cytometry contour plots (left) and quantification from n = 7 mice/group (right) are shown. (E) The frequency of Gr1+CD11b+ myeloid progeny was assessed by flow cytometry in the reverse chimeras generated in D (n = 7). (F) Frequency of the indicated BM stromal cell types in control and GzmB−/− mice was assessed by flow cytometry (n = 3). (G) Protein levels of IL12, IFN-γ, and VEGF were measured in the BM of WT and GzmB−/− mice by cytokine array (n = 3). (H) HSCs were isolated from GzmB-deficient mice, and RNA was subject to microarray analysis. A GSEA plot of cell cycle G1-phase genes is shown. P < 0.05 and normalized enrichment score (NES) = 1.77. Positively (red) and negatively (blue) correlated genes are shown. (I) HSCs were purified from WT and GzmB−/− mice, and Cdkn2d (p19) mRNA levels were measured by RT-PCR (n = 6). (J) Mitochondrial mass analysis of homeostatic WT and GzmB−/− HSCs as assessed by MitoTracker staining (n = 6). MFI, mean fluorescence intensity. Data in A–G, I, and J represent means ± SEM of two independent experiments. *, P < 0.05; ***, P < 0.001; and ****, P < 0.0001.

