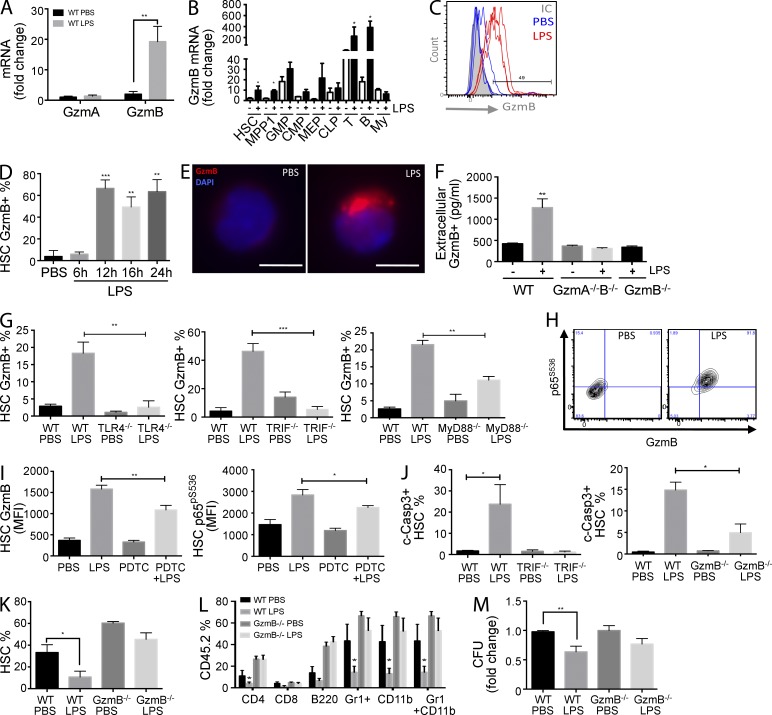
Figure 3.
LPS-induced GzmB expression in HSCs is dependent on TLR4–TRIF–NF-κB signaling, is secreted, and impairs HSC function in vivo. WT mice were injected with 5 µg LPS i.p. or PBS, and BM was isolated 16 h later. (A and B) GzmA and GzmB mRNA levels in HSCs (A; n = 6) and GzmB mRNA in BM hematopoietic cells (B; n = 6) were measured by RT-PCR. (C) Representative flow cytometry histogram showing GzmB protein expression in HSCs from mice injected with LPS or PBS (n = 3). (D) GzmB expression in HSCs was measured by flow cytometry at the indicated times after LPS treatment (n = 6). (E) LSK SLAM cells were purified from in vivo LPS-stimulated WT mice for 16 h, and GzmB cellular localization was assessed by immunofluorescence using anti-GzmB antibodies and DAPI nuclear staining (n = 4). Bars, 5 µm. (F–H) Mice of the indicated genotype were injected with LPS or PBS as in A (n = 6). (F) Extracellular GzmB (pg/ml) in the BM niche was measured by ELISA. (G) Percentage of GzmB-expressing HSCs (GzmB+) in TLR4−/−, TRIF−/−, and MyD88−/− mice was assessed by flow cytometry. (H) Representative flow cytometry contour plot showing p65pS536 and GzmB expression in HSCs from WT mice 16 h after LPS stimulation. (I) WT mice were pretreated or not with 10 mg/kg PDTC i.p., followed by LPS 10 h later. GzmB and p65pS536 expression in HSCs was measured by flow cytometry 16 h after LPS injection (n = 6). (J) WT, TRIF−/−, or GzmB−/− mice were injected with LPS or PBS as in A, and levels of active caspase-3 (c-Casp3) were measured in HSCs by flow cytometry (n = 6). (K) CD45.2 GzmB−/− or WT mice were injected with LPS or PBS, and HSCs were purified 16 h later, mixed with 106 WT CD45.1/2 BM cells, and injected i.v. into lethally irradiated WT recipients. HSC engraftment was measured by flow cytometry 16 wk after transplant (n = 6). (L) Frequency of the indicated hematopoietic cell types in the mice described in K. (M) GzmB−/− and WT mice were treated with LPS or PBS as in A, and CFUs of total BM cells were assessed. Three plates per point were scored per experiment, and cells were pooled from three different mice. Data represent means ± SEM of at least three (A–F) or two (G–M) independent experiments. *, P < 0.05; **, P < 0.01; and ***, P < 0.001.

