Figure 1.
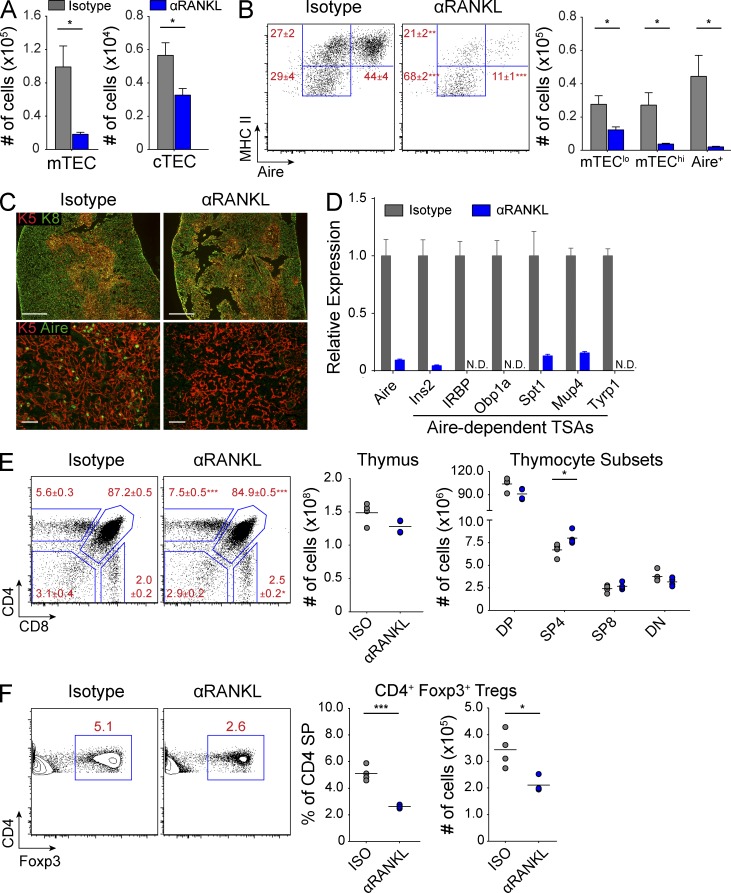
Selective depletion of mTECs with anti-RANKL blockade. (A) Wild-type mice were treated for 2 wk with either isotype (gray) or anti-RANKL (αRANKL, blue) antibody, and absolute numbers of mTECs and cTECs were enumerated by flow cytometry. Bar graphs of total cell numbers are depicted by mean ± SEM. (B) Representative flow cytometry plots of mTECs in A showing relative composition of mTEC subsets. Values represent mean ± SEM. Bar graphs (right) of total cell numbers of each mTEC subset depicted by mean ± SEM. (C) Top panels show immunostaining for keratin-8 (green) and keratin-5 (red) on thymic sections, and bottom panels show immunostaining for keratin-5 (red) and Aire (green). Bars: (top) 500 µm; (bottom) 50 µm. (D) Gene expression analysis on mTECs sorted from wild-type mice treated with either isotype (gray) or anti-RANKL (blue) antibody. Results standardized to Cyclophilin A and normalized to isotype-treated mice with bars depicting mean ± SD. (E) Representative flow cytometry plots of thymocytes from antibody-treated wild-type mice. Values depict mean ± SD. Total thymocyte numbers (right) are indicated with each circle depicting an individual animal and bars showing the mean. (F) Flow cytometric analysis of Foxp3 staining in CD4 SP thymocytes from E. Plots (right) show percentage and number of thymic CD4+ Foxp3+ cells, with bars showing the mean. Data shown in Fig. 1 is representative of two to four independent experiments containing three or more individual mice within each group. *, P ≤ 0.05; ***, P ≤ 0.001, Student’s t test.

