Figure 4.
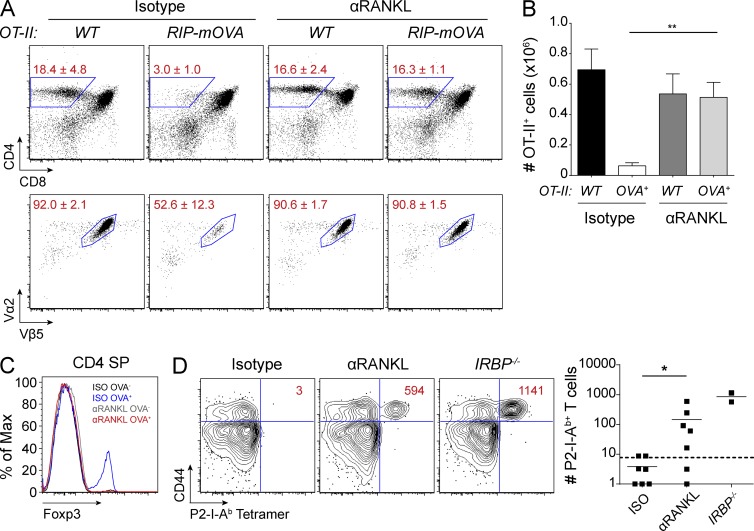
Anti-RANKL–mediated mTEC ablation leads to altered negative selection. (A) OT-II and OT-II x RIP-mOVA mice were harvested after 2 wk of indicated antibody treatment. Percentages of CD4 SP (top) and OT-II clonotype-specific (bottom) thymocytes are shown. Values represent mean ± SD. (B) Quantification of OT-II clonotype-specific CD4 SP cells from A. Graph shows mean ± SEM. **, P ≤ 0.01, Student’s t test. (C) Representative histograms for Foxp3 staining in CD4 SP events from A. (D) Wild-type mice were treated with isotype or anti-RANKL antibody for 3 wk, immunized with P2 peptide, and then harvested 10 d later for tetramer analysis. Representative flow cytometry plots of CD4+ T cells are shown for each condition. Values indicate absolute numbers of CD44+ P2-I-Ab–specific T cells. IRBP−/− mice were included as positive controls. Each dot on the graph represents an individual mouse, bars show mean, and the dotted line represents the limit of detection. Data shown is representative of two to three independent experiments. *, P ≤ 0.05, Mann-Whitney test.

