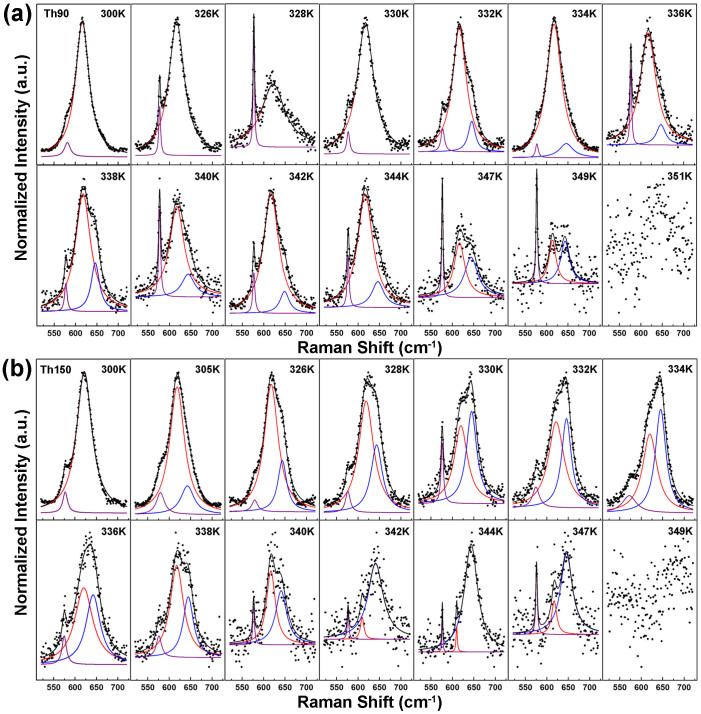
Figure 3.
Lorentz fitting results for the Raman spectra in the range from 520 cm−1 to 720 cm−1 measured at various temperatures for samples Th90 (a) and Th150 (b), respectively. (Black dots are the original data, black lines are the Lorentz fitting line, purple lines indicate the Eg mode of sapphire, red lines indicate the Ag mode of the M1 phase of VO2, and blue lines indicate the Ag mode of the M2 phase of VO2.)

