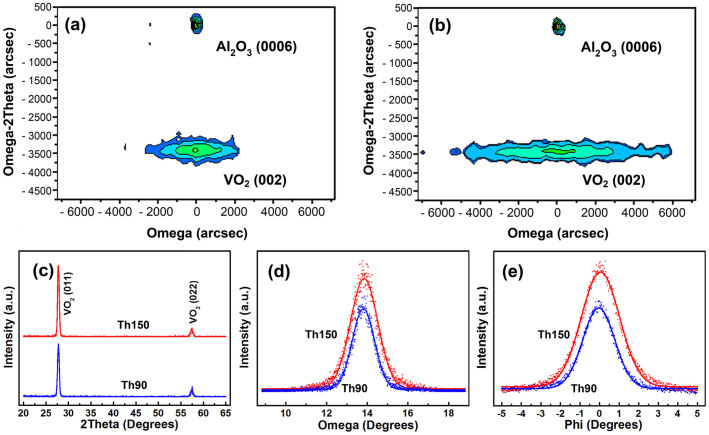
Figure 5.
(a) RSM around Al2O3 (0006) and VO2 (002) for sample Th90; (b) RSM around Al2O3 (0006) and VO2 (002) for sample Th150; (c) tilted XRD θ − 2θ scans (χ = 44.8416°) for samples Th90 and Th150, respectively; (d) Gaussian fittings of ω rocking curves of VO2 (011) for samples Th90 and Th150, respectively; (e) Gaussian fittings of ϕ scans of VO2 (011) for samples Th90 and Th150, respectively.

