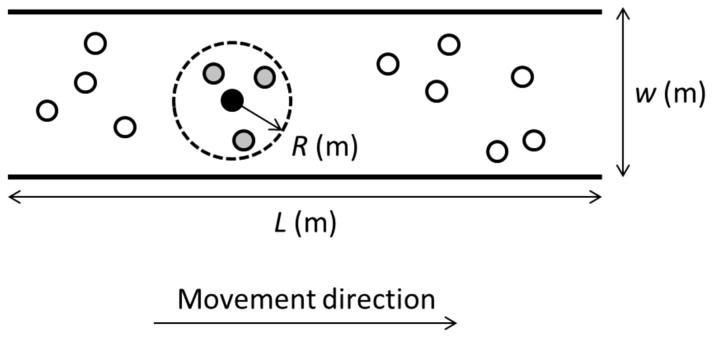
Figure 1. Illustration of corridor with periodic boundary conditions, length L metres and width w metres.
The small black circle shows a single infected individual, the larger dashed circle shows the radius R of infection, the smaller grey circles show individuals within the radius of possible infection, and the small white circles show individuals that are currently outside the reach of possible infection.

