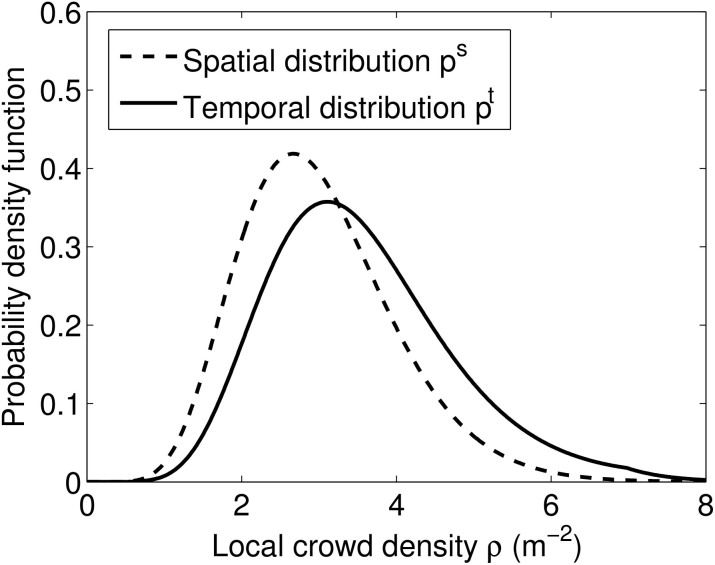
Figure 2. Probability-density of the spatial distribution ps of the local crowd density ρ in a space with an average crowd density  as an example, compared with the (spatio-)temporal distribution pt of local density across the same space.
The difference is due to a lower walking speed in high density areas, which will lead to individuals spending longer time in dense areas compared to lower density areas.

