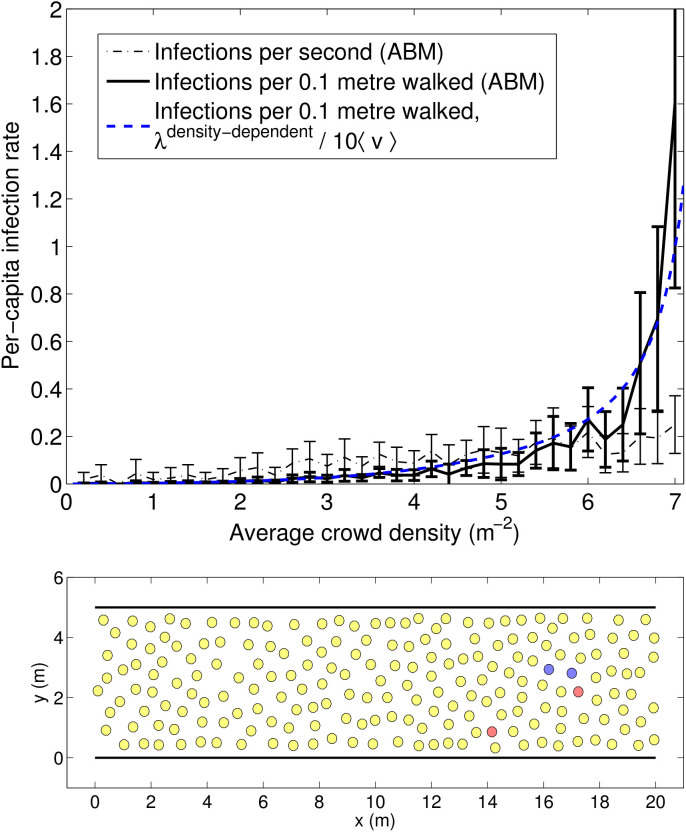
Figure 5. Top: Results of the agent-based model (ABM) of a unidirectional crowd flow in a corridor.
The curves correspond to the mean values of 10 simulations for a number of average crowd densities, and the error bars correspond to 1 standard deviation. The blue dashed curve is the same as in Fig. 3 for comparison. Bottom: Snapshot of the agent-based crowd model. Colours correspond to: susceptible (yellow); infected (red); and exposed (blue).

