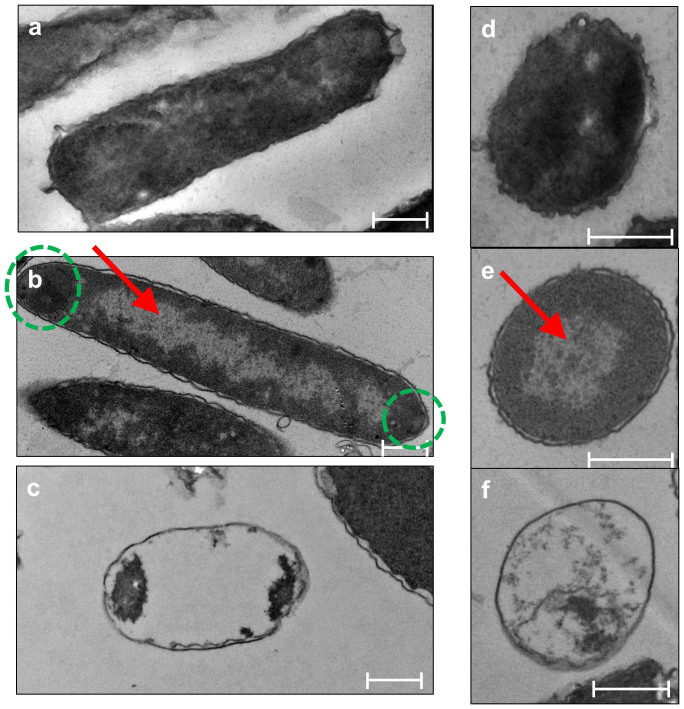
Figure 3. TEM images of cells producing GhoS, ArT, and GhoT.
(a) to (c): Longitudinal sections of BW25113/pCA24N-ghoS, BW25113/pCA24N-arT, and BW25113/pCA24N-ghoT, respectively. (d) to (f): Cross-sectional views of BW25113/pCA24N-ghoS, BW25113/pCA24N-arT, and BW25113/pCA24N-ghoT. Scale bars denote 0.5 µm. Red arrow indicates internal translucent areas, and green circles show condensed areas at the poles.

