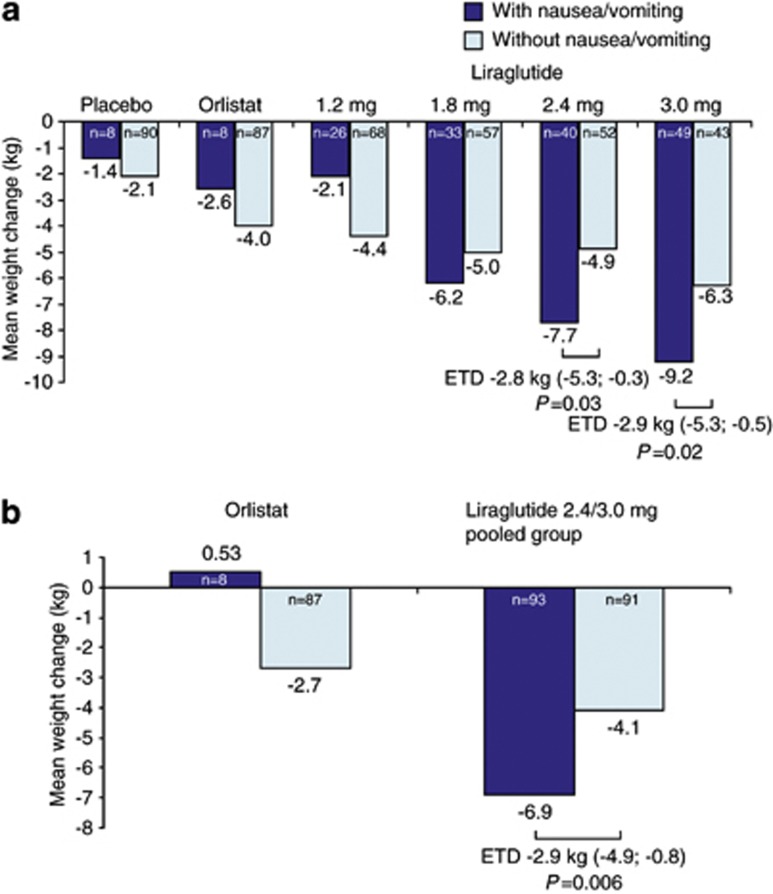
Figure 3.
Weight change at year 1 (a) and year 2 (b) in individuals with or without at least one episode of nausea or vomiting. Mean changes (analysis of covariance) are shown for the intention-to-treat population with the last observation carried forward. Estimated treatment differences (ETD) are shown, together with 95% CI.

