
FIG 1.
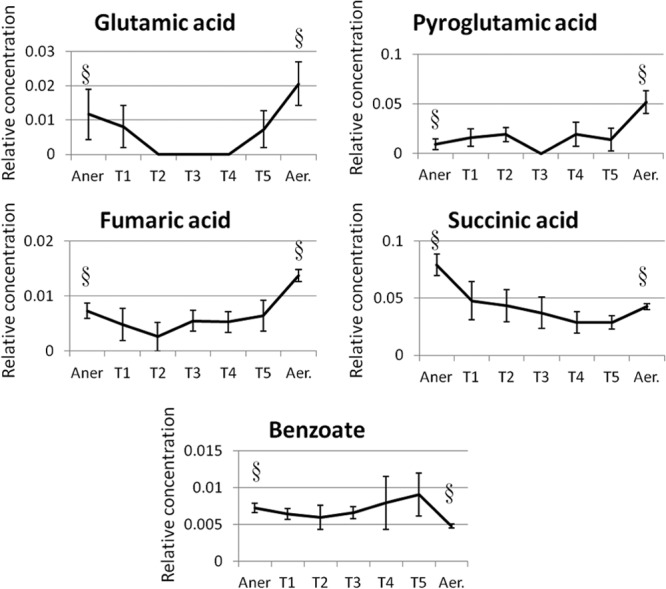
Changes in metabolite levels over time during transition from anaerobic to aerobic steady states (Aner, anaerobic steady state; T1, T2, T3, T4, and T5, transition states 1, 2, 3, 4, and 5, respectively; Aer, aerobic steady state). The relative metabolite levels have been normalized by the level of internal standard (2,3,3,3-d4-alanine) and biomass concentration. The error bars show the standard error between three biological replicates. The section signs (§) indicate the steady-state levels of the different metabolites before and after the transition state.