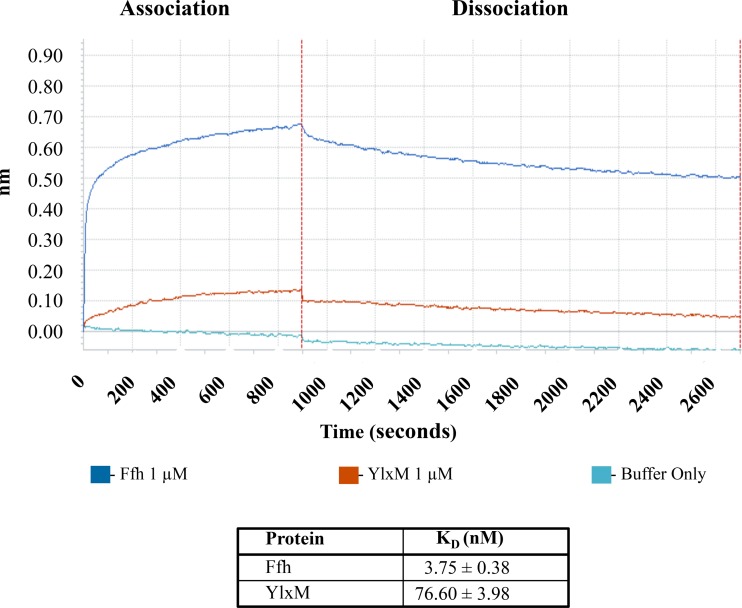
FIG 3.
Evaluation of the interactions of S. mutans Ffh and YlxM with scRNA by bio-layer interferometry. Association and dissociation curves of Ffh or YlxM, with scRNA coated on the sensor tip, are shown. Calculated equilibrium dissociation constants ± standard errors of the mean are shown in the table.

