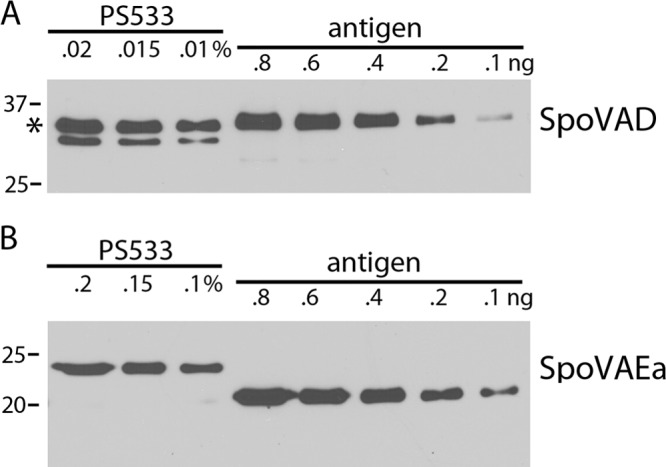
FIG 2.

(A, B) Levels of SpoVAD (A) and SpoVAEa (B) in wild-type spores. Various amounts of the total lysate from 8.2 × 10⁸ spores of strain PS533 (wild type) were subjected to Western blot analysis as described in Materials and Methods alongside various amounts of purified SpoVAD or SpoVAEa protein. (A) The intensities of the SpoVAD band in various amounts of the lysate (upper band at 36 kDa [asterisk]) were compared to the intensities of known amounts of purified SpoVAD. (B) The intensities of the SpoVAEa band at 23 kDa in various amounts of lysate were compared to the intensities of various amounts of purified ΔSpoVAEa that ran at ∼20 kDa. The molecular mass of the purified ΔSpoVAEa protein was lower than that of the SpoVAEa protein in the lysate, probably because the purified ΔSpoVAEa protein had an internal deletion, as described in Materials and Methods. Analysis of the various band intensities by ImageJ gave values of 5,800 molecules of SpoVAD/spore and 740 molecules of SpoVAEa/spore. The numbers of SpoVAD and SpoVAEa molecules per spore determined in three independent Western blot analyses were all within ±20% of these values. The values to the left of both panels are molecular sizes in kilodaltons.
