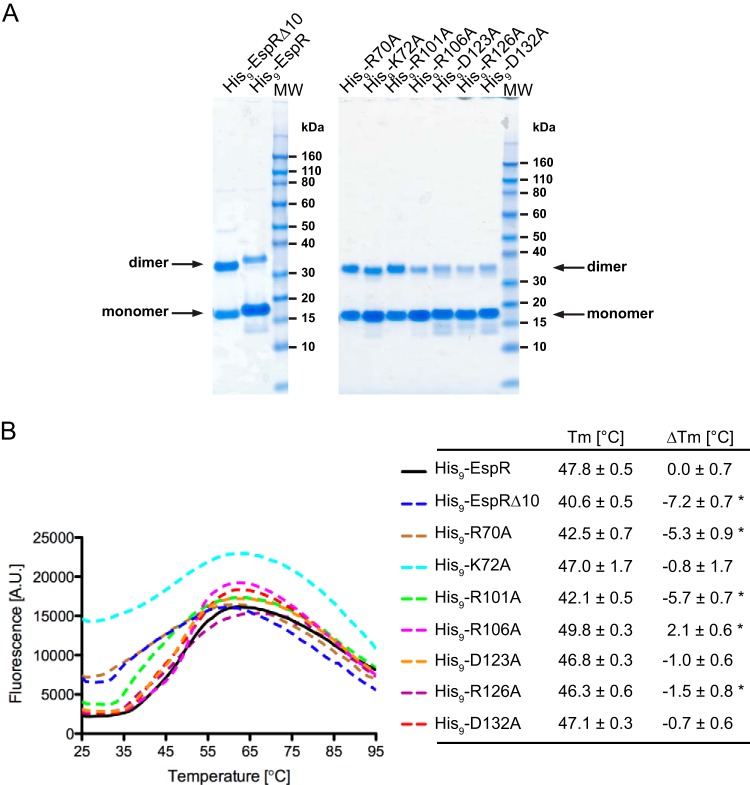
FIG 2.
Stability of the EspR wild type and mutants. (A) His9-EspR wt and mutants were expressed and purified as described in Materials and Methods. The arrows indicate their migration bands corresponding to the molecular masses of the monomeric and SDS-resistant dimeric forms in SDS-PAGE. MW, molecular size ladder. (B) Melting profiles of purified proteins as monitored by measuring Sypro orange fluorescence as a function of temperature with a real-time quantitative PCR (qPCR) instrument. Tm values were calculated by fitting the melting curve data to the Boltzmann model. ΔTm represents the change in the melting temperature of EspR mutants from that of the wt protein. Indicated values are averages ± SD for a minimum of six measurements of protein unfolding. Asterisks mark significant differences (P < 0.001) from results for wt EspR. A.U., arbitrary units.

