FIG 4.
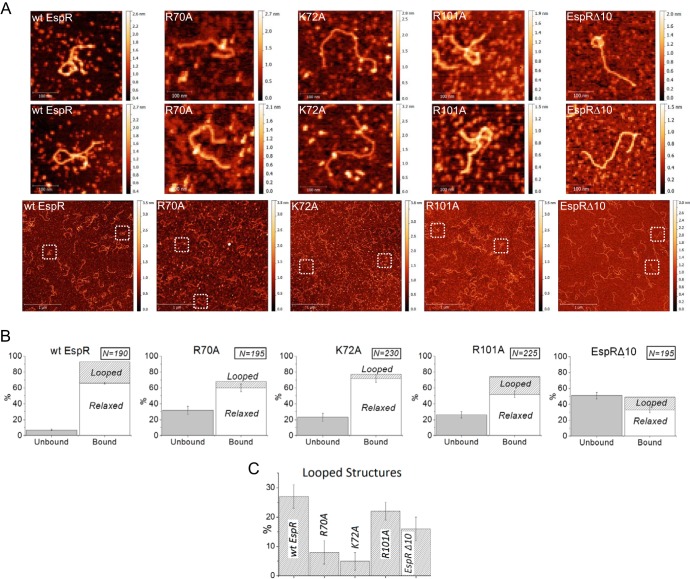
AFM imaging of DNA-EspR (wild-type and mutant) complexes. (A) wt EspR (7.2 μM) incubated with PespACD (6 nM) shows large amounts of DNA-protein complexes with frequent DNA loop formation. In contrast, the R70A, K72A, and EspRΔ10 mutants exhibit significantly lower affinity for the PespACD DNA than wt EspR and show almost no DNA loop formation under identical conditions; the R101A mutant exhibits lower DNA affinity than wt EspR but still forms some DNA loops that are similar to those formed by wt EspR. The first two rows show zoomed images (305 by 305 nm) of selected DNA molecules from the corresponding (same column) representative large-field AFM images (3 by 3 μm) on the third row. (B) Quantification of PespACD binding and DNA loop formation mediated by EspR wt and mutants as measured by AFM. The number of DNA molecules analyzed for each protein-DNA binding reaction is indicated. The standard error bars indicate the variation in the number of “bound” versus “unbound” DNA molecules observed in the different AFM images for a given protein-DNA binding reaction. (C) Comparison of the percentages of looped DNA structures (± standard errors) induced by the different proteins tested.

