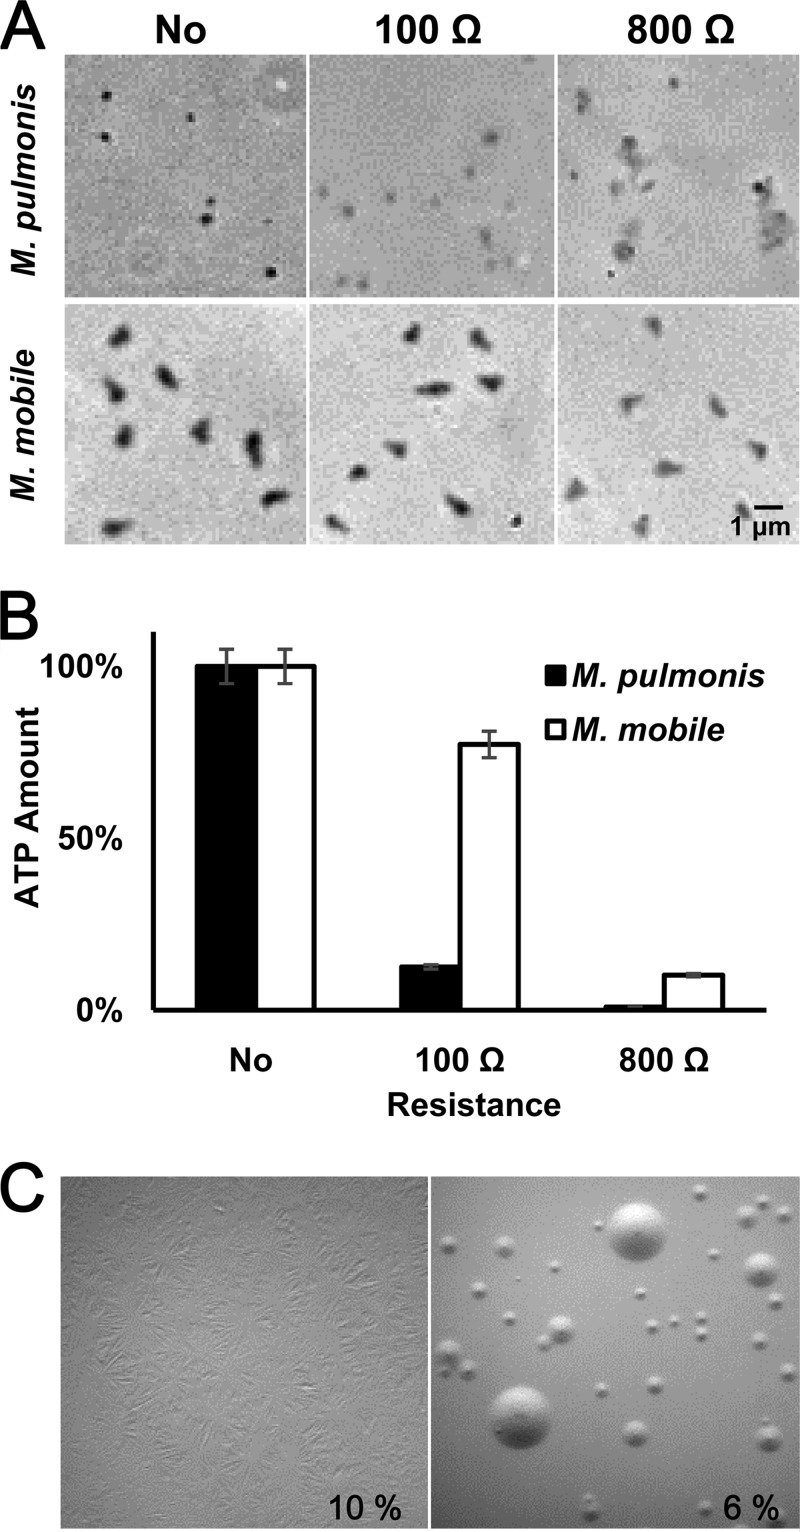
FIG 2.
Optimizing the conditions for transformation. (A) Cell images of M. pulmonis and M. mobile after electroporation under different conditions. Cells without electroporation (No) or electroporated using a resistance of 100 Ω or 800 Ω were observed by phase-contrast microscopy. (B) The amounts of ATP in the cells after electroporation under different conditions. The amounts of ATP in the cells without electroporation were normalized to 100%. (C) Formation of film and spots under different concentrations of serum. The serum concentration applied to the solid medium is indicated in each panel. Film and spots formation covers the medium surface only in the left panel. The surface of the solid medium was observed 7 days after inoculation.

