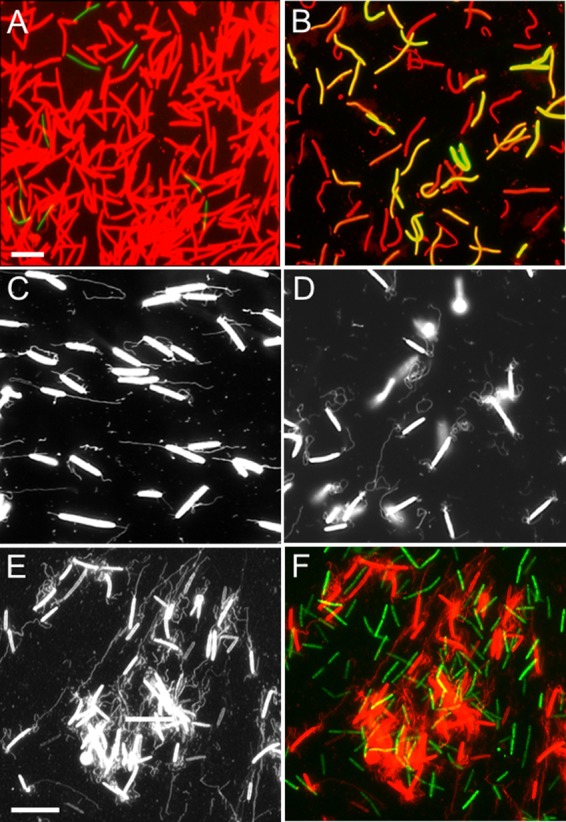
FIG 7.

OM exchange and OMT production are distinct processes. (A) A 20:1 ratio of SST1-mCherry donor (DW1477) and GFPCyto-labeled recipient (DW1414; ΔpilA) cells was incubated on TPM agar at high cell density (3 × 10⁹ CFU/ml) for 10 h. Cells were harvested, washed, and microscopically examined as described previously (3). (B) As for panel A, except that donor strain (DW1047) cells contained SSOM-mCherry and were mixed with the recipient (DW1414) cells at a 1:1 ratio. Both panels A and B show green and red merged fluorescent images. Bar in panel A represents 8 μm for panels A and B. (C) traA (DW1412) mutant cells make OMTs. (D) traB (DW1413) mutant cells make OMTs. (E and F) Donor (DW1411; PpilA-SSOM-mCherry) and recipient (DW709; PpilA-gfp) cells were mixed at 1:1 ratios at high cell density in liquid and incubated for 4 h. (E) High-contrast black-and-white image for OMT visualization by the SSOM-mCherry reporter. (F) Identical field, except that it is a colored image merged with an image of GFP-labeled recipient cells, revealing no OM exchange. Bar in panel E represents 8 μm for panels C to F.
