
Figure 2.
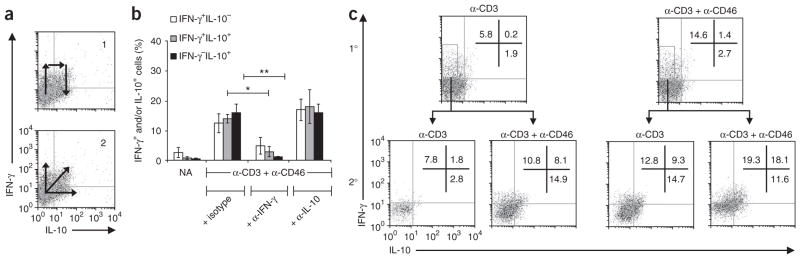
CD46–IL-2 signals induce a switch from a TH1 phenotype to a suppressive Tr1 phenotype in CD4+ T cells. (a) Flow cytometry of the induction of IL-10-secreting T cells by anti-CD46 from an initial TH1 effector cell (1) or from a distinct cell subset (2). (b) TH1 lineage induction in purified CD4+ T cells left not activated or activated with anti-CD3 and anti-CD46 plus IL-2 (50 U/ml IL-2) and isotype-matched control antibody or neutralizing mAb to IFN-γ or IL-10, presented as the percentage of cytokine-positive (Cyt+) cells: IFN-γ+IL-10−, IFN-γ+IL-10+ or IFN-γ−IL-10+ (key). *P < 0.05 and **P < 0.01 (Student’s t-test). Data are representative of three experiments (mean ± s.d.). (c) Secretion of IFN-γ and IL-10 by IFN-γ+IL-10− cells isolated by flow cytometry from purified T cells activated for 36 h (primary stimulation (1°)) with anti-CD3 alone or with anti-CD3 and anti-CD46 in the presence of IL-2 (5 U/ml); the IFN-γ+IL-10− populations were expanded for 4 d with IL-2 (5 U/ml), then restimulated (above plots; secondary stimulation (2°)) and assayed 18 h later. Numbers in plots indicate percent IFN-γ+IL-10− cells (top left), IFN-γ+IL-10+ cells (top right) or IFN-γ−IL-10+ cells (bottom right). Data are representative of four experiments.