Figure 3.
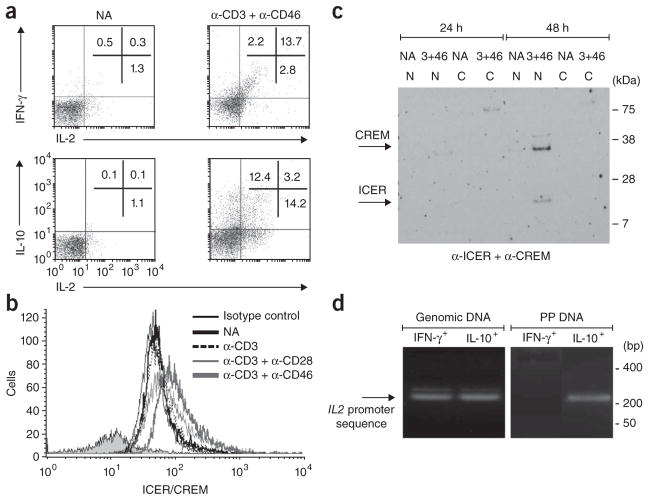
CD46-mediated signals contribute to the regulation of IL-2 expression by CD4+ T cells. (a) Secretion of IFN-γ, IL-10 and IL-2 by T cells either not activated or stimulated for 36 h with anti-CD3 and anti-CD46. Numbers in plots in top row indicate percent IFN-γ+IL-2− cells (top left), IFN-γ+IL-2+ cells (top right) or IFN-γ−IL-2+ cells (bottom right); numbers in bottom row indicate percent IL-10+IL-2− cells (top left), IL-10+IL-2+ cells (top right; also IFN-γ+ (data not shown)) or IL-10−IL-2+ cells (bottom right). (b) Intracellular flow cytometry analysis of ICER/CREM expression after 36 h of no activation or activation with various combinations of mAbs to CD3, CD28 or CD46 (key) or isotype-matched control antibody (Isotype control). (c) Immunoblot analysis of the nuclear translocation of ICER/CREM, assessed in cytoplasmic (C) and nuclear (N) protein fractions of purified T cells either not activated or activated for 24 or 48 h with anti-CD3 and anti-CD46 (3+46). Right margin, molecular size in kilodaltons (kDa). (d) Chromatin-immunoprecipitation analysis of the binding of ICER/CREM to the IL2 promoter in IFN-γ+IL-10− cells (IFN-γ+) and IFN-γ−IL-10+ cells (IL-10+) induced with anti-CD3 and anti-CD46, presented as PCR amplification of an IL2 promoter–specific sequence from genomic DNA (control; left) or from DNA precipitated with anti-ICER/CREM (PP DNA; right). Right margin, size in base pairs (bp). Data are representative of three (a,b,d) or two (c) experiments.

