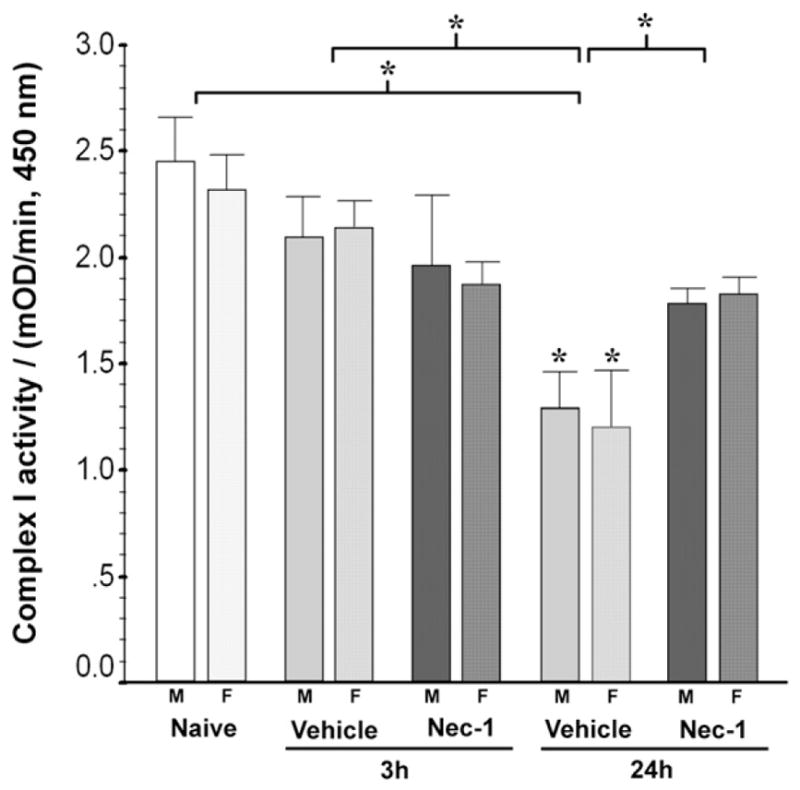
Fig. 3.

Nec-1 treatment prevents the progressive decline in complex-I activity in the ipsilateral mouse forebrain following neonatal HI in both genders. Bar graph shows the mitochondrial complex-I activity in forebrain at 3 and 24 h following neonatal HI. Bars represent the mean±SEM measured in naive control (white), vehicle (light gray) and Nec-1 (dark gray)-treated male (solid color, M) and female (hashed color, F) mice. p ≤ 0.05 in both genders (one-way ANOVA). *, vs. naive control; p<0.05 (Tukey’s post hoc). n=4–11 mice/ treatment/time/gender. Bracket and *, represent p ≤ 0.05 for the whole pool (ANOVA, p<0.001).
