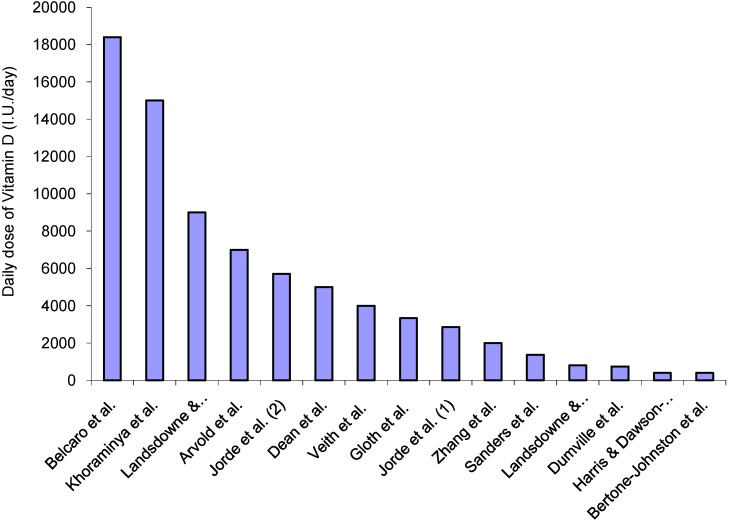
Figure 1.
Daily dose of Vitamin D per study. This shows the range of equivalent daily doses. (These were calculated after estimating the actual dose rather than using the dose shown in their published papers).
Low doses of 400 I.U. in Harris & Dawson-Hughes [30] and Bertone-Johnson et al. [38]; High doses were over 15,000 I.U. per day in Belcaro et al. [42] and Khoraminya et al. [49]; Jorde et al. [37] and Landsdowne & Provost [39] both tested three groups; two differing dosages and one placebo.

