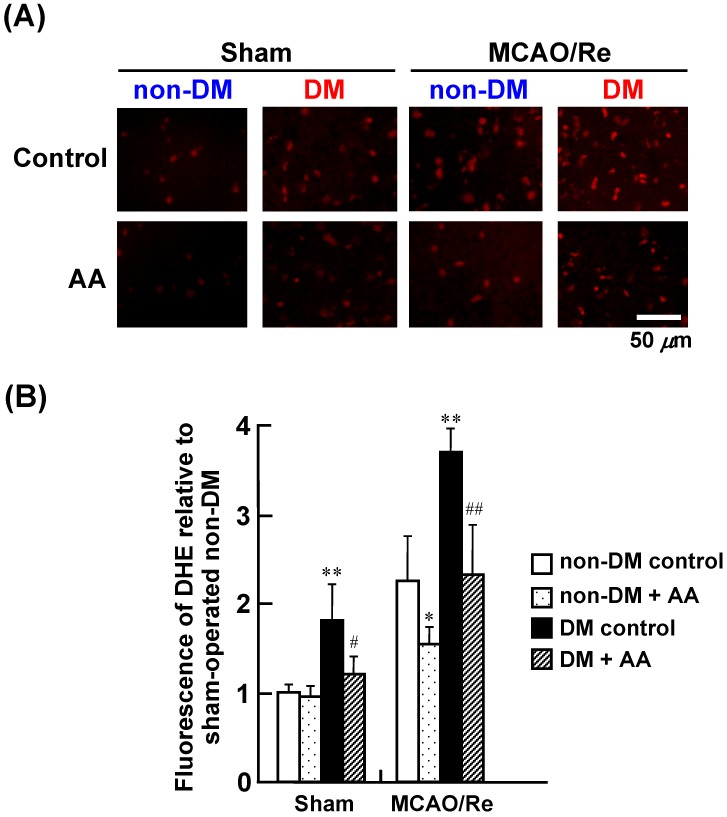
Figure 3.
Effects of AA supplementation on production of O2– after MCAO/Re in the brain of nondiabetic and diabetic rats. (A) Representative photographs of superoxide production detected by DHE staining in coronal sections of the cortex from the nondiabetic and diabetic rats; (B) Quantitative analysis of DHE fluorescence intensity in the cortex. The data are presented as mean ± SD (n = 3–4). * p < 0.05, ** p < 0.01 compared with the nondiabetic control group. # p < 0.05, ## p < 0.01 compared with the diabetic control group. DM in the figure denotes diabetic, while non-DM denotes nondiabetic.

