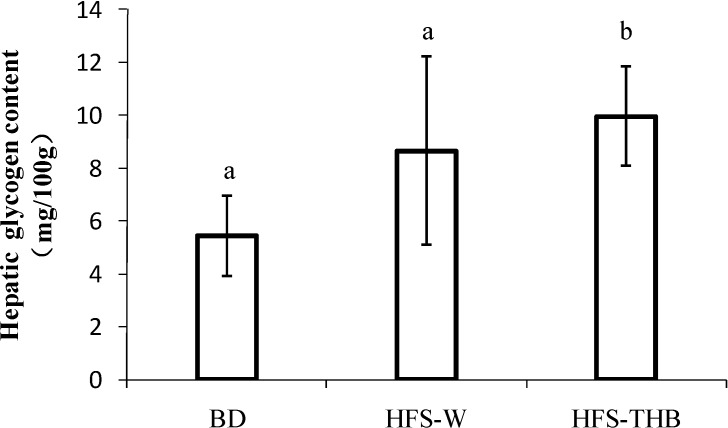
Figure 3.
Hepatic glycogen in rats at the end of the 15-week study. Samples were analyzed using a one-way ANOVA followed by a Turkey post doc test. Evaluations were taken among three groups, a, b indicate statistical differences (P < 0.05), the same letters indicate no statistical differences (P > 0.05).

